Bioinformatician growth

A bioinformatician on my team is always looking to grow and improve their skills. These checklists help identify the skills to develop and the knowledge to acquire.

The checklists are the minimum required to move to the next level. The full set of requirements is discussed and agreed with the manager. You need to complete every checklist item to advance, but completing them all does not guarantee advancement: the manager may also set individual requirements.

My team works in oncology and mainly deals with NGS data, so some items are specific to those areas. Some of the linked learning resources are in Russian.

Trainee

Knows the basics of molecular biology, statistics, and NGS analysis. Understands the null hypothesis, p-values, Fisher’s exact test, the chi-squared test, the t-test, the Mann–Whitney U test, and multiple testing correction.

Can run a Jupyter notebook and use Python to read a data frame, filter its columns, and draw a histogram and a scatter plot.

Learns the principle that working on something is not the same as getting it done. Shows relentless drive. Will revise test assignments and work tasks ten times if needed, persists from the very first tasks, and is not afraid of unfamiliar topics.

Takes responsibility. The particular task matters less than the ability to take ownership and deliver a result. Volunteers to keep time at a team meeting, find the person responsible for the office and get a chair repaired, work out how to download a dataset, or set up an agent and write instructions for colleagues.

Learns to organize their work. Until they gain experience, works on simple, routine tasks under close supervision from senior colleagues. Keeps track of their tasks and takes meeting notes without being reminded.

Studied

Read

Delivered

  • Completed a project under the supervision of senior colleagues and presented the results

Bioinformatician

An independent operator. Handles routine tasks independently and complex ones with a manager’s support, without constant supervision. Finds or requests the information they need, tracks deadlines, and raises concerns in time.

Has at least one project of their own: a client project, an internal R&D project, a Confluence space, a blog, a channel, or a product.

Learns to be flexible: resolves tensions between deadlines and quality through ingenuity and flexible scope, rather than by sacrificing deadlines, quality, or personal time.

Learns to verify rather than trust. Can establish and explain that their own analysis, or work by a colleague, another department, or an agent, is based on real data and appropriate methods and does not overlook the obvious.

Cohort analysis is a core skill. Can obtain a cohort and its annotations, assess data quality, analyze genetic events, and put the results into a presentation.

Is well read and well prepared. There is no such thing as a bioinformatician who has not read Hallmarks of Cancer or cannot write a skill for Claude.

Is not afraid of unfamiliar work. Will run an agent, write code and submit a pull request, start a Docker container, inspect a BAM file in a genome browser, run differential expression analysis, or put together a presentation.

Learns to negotiate: understands the client’s problem and their own capacity, agrees on deadlines, and resolves conflicts.

Read

Studied

  • Working with an AI agent on a real task: defining the task, checking the result, and finding an error
  • How bioinformatics tools work and where their limits lie: BWA, Strelka, Sequenza, kallisto, STAR, and STAR-Fusion
  • Sequencing quality metrics

Delivered

  • Contributed to two projects led by senior colleagues
  • Independently completed a research or cohort analysis project from start to finish
  • Built something together with developers, taking ownership of the work
  • Gave a lecture on an educational course

Collected

  • 20 observations

Lead bioinformatician

Leads the team of independent operators. Represents bioinformatics to the client, from the initial request to the final result. Handles all aspects of the client relationship and takes responsibility for them.

Knows the deadlines, writes client proposals, plans iterations, and manages the project. Solves problems by designing and building a real product. Takes responsibility for its usefulness, delivery date, and quality. Answers for every chart and comma in a paper or product. Finds flexible solutions.

Chooses and supervises the people doing the work within the department and delegates tasks. Has projects of their own, a blog or channel, and maintains a section in Confluence.

Read

  • Genrikh Altshuller. Find an Idea

Managed

  • Independently explained a product feature to another department — developers, biologists, or clinicians — and handed it over for implementation
  • Reviewed work by a specialist in another department, wrote feedback, checked the revisions, and accepted the result. In other words, made sure the work was done properly
  • Independently sorted out a messy situation with another department: understood the conflict, motivated people, and resolved the organizational problem

Delivered

  • Attended five meetings with new clients and asked questions
  • Wrote five task briefs and got them approved by the clients
  • Delivered five practical tasks under their personal responsibility: presented an analysis to a physician, submitted work to a conference, or released a component update
  • Solved a problem through other people’s work

Developed

  • Helped a trainee become a bioinformatician. Preferably two, or even three

Shared knowledge

  • Gave a public lecture

Standardized

  • Improved three things in the bioinformatics department’s work and agreed new procedures, standards, or principles
  • Got five templates for replies, mailings, or pages approved

Collected

  • 100 observations

Director

The defining quality is effectiveness: always knows what result is needed and how to achieve it. A director has many tasks, projects, employees, clients, and other concerns, so allocates time to influence everything that matters to the result.

An entrepreneur and strategist. Rather than solving a task as a team lead does, sets tasks in a sequence that produces the greatest effect with the least waste.

A standard setter. Improves procedures, processes, and tools. Each improvement benefits many projects.

A magician. Helps managers and teams with simple, effective advice that makes them say, “Wait, we could do that?” Does not keep track of deadlines unless the lead bioinformatician brings them up. Is the final quality check, but not the main one: that responsibility belongs to the lead bioinformatician. Does not put up with crap and keeps pushing back against deadlines — and, in effect, against the lead bioinformatician.

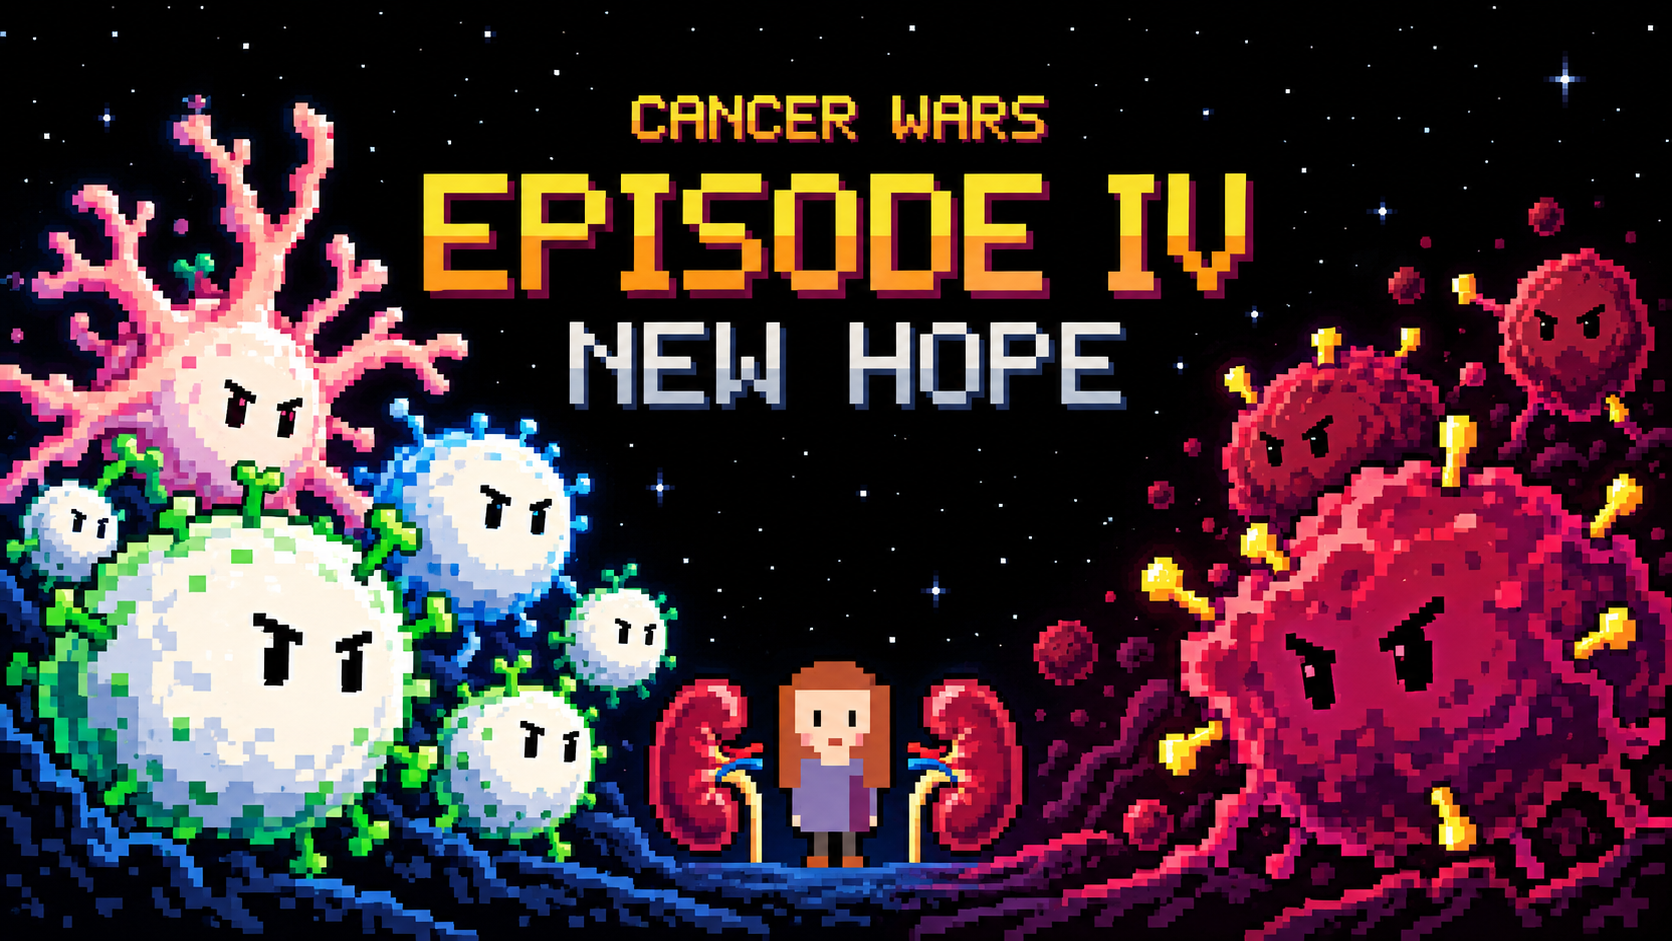
Cancer Wars. Episode IV — A New Hope

Sixteen Years

In 1998, a hospital in Glasgow performed two kidney transplants, one in a man and one in a woman. These are complex operations followed by demanding treatment, but fortunately both kidneys took and functioned perfectly normally. A year and a half later, however, a routine examination revealed a small tumor in the woman’s breast. A few weeks later, several more small tumors appeared, this time under her skin. Tests showed that they were melanoma metastases. In March 2000, the patient died. Two months after her death, a tumor was found in the transplanted kidney of the man who had received his transplant at the same time. Once again, a biopsy showed melanoma.

The Scottish donor registry connected the two stories. Both kidneys had come from the same woman, who had died in May 1998, apparently from a hemorrhage beneath the membranes surrounding the brain. And here was the strange part: she had had melanoma sixteen years before her death. She had undergone surgery and treatment, then lived for fifteen years without signs of disease, attending follow-up appointments at a local clinic. Eventually, she was discharged as apparently healthy. A year after that discharge, she died, and the story of the transplanted kidneys began.

Sixteen years. Could melanoma cells really have survived somewhere in her body all that time, then traveled into the recipients with the transplanted kidneys? Where had those cells been hiding? What had kept them in check? And why did they wake up in someone else’s body?

MacKie R. M. et al. Fatal Melanoma Transferred in a Donated Kidney 16 Years after Melanoma Surgery. New England Journal of Medicine, 2003.

At about the same time, across the Atlantic in St. Louis, a young researcher named Vijay Shankaran and his colleagues were investigating this question experimentally. They compared tumor development in mice with intact and impaired immune defenses. The immune defect arose because the mice lacked RAG2, an important protein needed for T and B lymphocytes to mature. All the mice received the same dose of a carcinogen, but sarcomas developed more often in the group with impaired immunity: 30 of 52 immunodeficient mice developed sarcomas, compared with 11 of 57 ordinary mice. Without mature lymphocytes, tumors appeared more frequently and sooner. The immune system really did influence their fate.

But how does a mobile immune cell recognize that one of the body’s own cells has become dangerous? And where does its order to act come from? To reach that order, we need to go back thirty years, to a cell that did not even have a name yet.

A Cell Without a Job

In 1970, a young physician named Ralph Steinman joined Zanvil Cohn’s laboratory at Rockefeller University. Cohn studied macrophages, large cells of the innate immune system that engulf microbes and cellular debris. Steinman was interested in what happened next: once a macrophage had swallowed something, what happened to the cellular remains and proteins, and how did an encounter with foreign material activate lymphocytes?

When he joined Cohn, macrophages were considered likely intermediaries between an antigen and a lymphocyte. One idea at the time was that a macrophage captured a foreign protein, preserved it, and presented it to lymphocytes for recognition.

For two years, Steinman watched macrophages and ran all kinds of experiments. He wanted to find a foreign protein on a macrophage’s surface. But the results did not fit the original idea comfortably. The protein could indeed be detected inside the cell, but once inside, it ended up in vesicles called lysosomes, where it was broken down. Macrophages readily engulfed the material under study, yet the expected transfer of an intact protein to lymphocytes could not be seen. The authors described this difficulty in the paper’s conclusion.

Steinman began looking for another cell and turned to the spleen. Earlier work had reproduced immune responses in cultures of spleen cells, but purified lymphocytes needed help from additional cells that adhered to their surfaces. In 1972, in this mixture, he noticed unusual, mobile cells with branching extensions.

These strange cells stretched out thin processes, drew them back, and changed shape again. According to a biographical account, the first observation took place in 1972. Steinman called Cohn over to his microscope. Cohn’s wife, Fern, later recalled her husband coming home with news of Ralph’s important discovery.

A year later, Steinman and Cohn published their description of the new cell type. Because of the branching processes, they called the cells dendritic, from the Greek word for tree.

Colleagues doubted that such a rare cell could play a decisive role. But in 1978, Steinman and his colleague Margit Witmer showed that dendritic cells were at least a hundred times better than other spleen cells at initiating a lymphocyte response.

By then, Steinman had a student of his own: Michel Nussenzweig.

Passing On the Find

A hundredfold advantage in a test tube did not yet establish a leading role in a living spleen. Dendritic cells made up only a small fraction of its cells, and any result could be attributed to their neighbors. To find out who was actually doing the work, the researchers had to remove dendritic cells, and only dendritic cells, from the mixture. The laboratory produced an antibody called 33D1 that bound specifically to dendritic cells. Together with complement, blood proteins that puncture the membranes of antibody-coated cells, it killed dendritic cells right in the test tube while leaving the others intact. The treated spleen cells were mixed with lymphocytes from a genetically different mouse. In such a mixture, lymphocytes respond to foreign tissue markers, much as they do during transplant rejection. In the 1983 study, removing dendritic cells reduced this reaction by 75–90 percent. Adding purified dendritic cells restored it, and an addition amounting to just half a percent of the stimulating cells was enough.

Gradually, a picture emerged of how the body assembles its immune defenses. Among the many T lymphocytes, only a small fraction can attack other cells. They must receive a signal, multiply, and develop into cells that can reach the relevant tissue. A dendritic cell connects these events: it collects material, presents fragments of it to a lymphocyte, and, given the appropriate signals, initiates a response.

The Display Window

But what exactly does a dendritic cell show a lymphocyte? A T lymphocyte cannot look inside another cell. It sees only what is displayed on the surface, where molecules called MHC play a central role. In humans, these molecules are called HLA. How this encounter worked remained a mystery for a long time.

The answer came from crystallography. At Harvard, in Don Wiley’s laboratory, Pamela Bjorkman and her colleagues spent several years trying to obtain crystals of the HLA-A2 molecule. In 1987, they published its structure. The top of the molecule turned out to be a groove, with two long helices along the edges of a flat floor. And inside that groove was something nobody had put there: on the electron density map, the cleft was occupied by foreign material that the molecule had picked up while it was still in the cell. Later, this material was identified as short protein fragments: peptides.

The display window had come into view. A cell continually cuts up some of its proteins into peptides and displays them outside, in the grooves of MHC class I molecules. A T lymphocyte checks what is on display without looking inside. If a viral or altered protein appears in the cell, a fragment of it can appear in the window.

A dendritic cell can do more: on MHC class I, it can display material captured and processed from another cell, as well as material from inside itself. This pathway was named cross-presentation. It allows killer T lymphocytes to be prepared for an encounter with a tumor before they reach it themselves.

How important this was for tumor defense was tested in 2008. Kai Hildner and his colleagues used mice lacking the Batf3 gene. These animals had almost none of one branch of dendritic cells specialized for cross-presentation. A fibrosarcoma that ordinary mice rejected grew in these animals; at the same time, the initiation of specific cytotoxic T-cell responses was impaired. In this transplantation model, the defenses failed to assemble without the necessary intermediaries.

From a strange cell under a microscope came an explanation of how many cells begin to act together: one finds a clue, another receives an order, and their descendants go on the attack.

But remember that the tumor arose from the body’s own cells. What happens if the body decides to attack itself? When that happens, a particular group of diseases develops: autoimmune diseases. But that is not our case. We know that something has changed inside the malignant cell. What on its display window might reveal that change?

A Clue from the Body Itself

In the late 1970s, while Varmus and Bishop in San Francisco were discovering that the viral oncogene src was present in the normal cells of birds and mammals, Lloyd Old’s group in New York, on the other side of the country, was studying features on the outside of tumor cells. They were looking for molecules on human malignant cells that the patient’s own immune system could recognize. The method was called autologous typing. Researchers took tumor cells and lymphocytes from the same patient and watched to see whether one would attack the other. The patient’s own cells against the patient’s own cells, with no foreign tissue and no mice.

A young German physician named Alexander Knuth took part in this work. Among the thirteen melanoma patients the group studied, the strongest reaction came from a man identified by the initials A.V. His T lymphocytes killed cells from his own tumor, grown in a culture called SK-MEL-29. In 1981, Knuth returned to Mainz and continued the same work. There, a second such patient was found, a woman identified in the scientific papers as MZ-2. She had stage IV melanoma, with metastases in the kidney, ovaries, lymph nodes, and spleen. Repeated operations and chemotherapy had not produced complete remission. But her T lymphocytes, like A.V.’s, recognized her tumor cells. Remember both patients: in each, the immune system had found its own clue in the tumor.

They recognized it, but what exactly were they recognizing? To find out, in 1984 Alexander Knuth followed the advice of his former mentor Lloyd Old and traveled to Brussels to meet another scientist, Thierry Boon. Boon’s group had developed a method that used activated T cells to find the tumor gene responsible for activating those same lymphocytes.

Boon and Knuth began the search. They took two types of cells from patient MZ-2: killer T cells and melanoma cells. From the killer T cells, they grew clones that were best at recognizing and destroying the melanoma cells. In the second stage, they continued to bring these selected killer T cells into contact with melanoma, but now selected only the rare melanoma cells that escaped their killers by losing the target. There were now three kinds of cells: killer T cells, ordinary melanoma cells, and escape variants. The third stage was the largest. They made a library from the ordinary melanoma: DNA was chopped into large pieces and inserted into hundreds of thousands of plasmids, circular DNA molecules used as carriers. They introduced these plasmids in batches into the escape cells. The idea was this: if introducing a plasmid caused a killer T cell to recognize and destroy the escaping melanoma again, that cosmid must contain the gene that produced the molecule displayed on MHC-I. And they found such a gene.

What would you expect from the gene they had found? After everything we know about mutations in cancer, the answer seems obvious: an altered protein would give the tumor away. In 1991, Pierre van der Bruggen, Alexander Knuth, Thierry Boon, and their colleagues published the gene. They named it MAGE, from melanoma antigen. It was the first gene for a human tumor antigen recognized by the patient’s own T lymphocytes. And the surprising thing was that it was not mutated! It was exactly the same in the patient’s normal cells. Only four years later would the mystery begin to clear: in a normal body, this gene is silent almost everywhere except in immature sperm cells in the testis. In melanoma, it had switched on at the wrong time and in the wrong place. What gave the tumor away was not an altered protein, but one of the body’s own proteins appearing where it should not.

And what about the first patient? Work with his cells continued in Mainz, and in 1995 Thomas Wölfel’s group found what A.V.’s lymphocytes were targeting. This time, it really was a mutation, in the CDK4 gene, whose protein helps a cell move toward copying its DNA. At position 24, cysteine had replaced arginine. The substitution was present in the melanoma and absent from the patient’s lymphocytes. Inside the cell, it interfered with CDK4 binding to the inhibitory protein p16, weakening one of the brakes on cell division. Outside the cell, a fragment of that same altered protein, displayed on HLA-A2, became a target for the patient’s T cells.

A mutation that weakened an internal brake on division simultaneously left a trace for external surveillance. A target arising from a mutation is called a neoantigen. The cell escaped one constraint and became more visible to another.

Two clues, two ways to give yourself away. MZ-2’s melanoma switched on something that should have stayed silent. A.V.’s melanoma broke something that should have worked. Both traces end up in the same display window, and the immune system can read both. If the Glasgow donor’s melanoma had even one such clue, there was something for the guards to see.

We can now assemble the chain of a targeted attack. A dendritic cell acquires tumor material and helps activate the appropriate T lymphocytes. Their descendants arrive in the tissue and inspect peptides on the surfaces of cells. On finding its target, a cytotoxic lymphocyte delivers a lethal strike.

But what if the tumor removes the display window itself: the MHC-I molecules? This is where the story of recognition took an unexpected turn.

A Line in a Dissertation

In the autumn of 1981, Klas Kärre was working on his dissertation at the Karolinska Institute. He was interested in natural killer cells, or NK cells. They could destroy certain tumor cells without prior immunization, but the rule by which they chose their targets remained unclear. What common features linked the very different cells they attacked?

Kärre later recalled struggling with a single sentence. He was trying to describe susceptible cells and noticed that it was much easier to state what resistant cells possessed. The question turned around: what feature allows a cell to avoid attack?

MHC-I already occupied a central place in ideas about recognition. Kärre proposed that its presence might serve as a signal holding an NK cell back from attacking. The disappearance of a familiar feature would then change a cell’s fate. To notice danger, it was not always necessary to find a new foreign molecule. Sometimes, losing a normal feature of the self could be enough.

The idea still had to be made to work in an experiment. A twenty-two-year-old student, Hans-Gustaf Ljunggren, joined Kärre. His summer project was to test whether NK cells could recognize tumor cells that had lost certain molecules belonging to their own organism.

The researchers took a mouse lymphoma resistant to NK cells and obtained variants with sharply reduced amounts of MHC-I. In the first stage of the experiment, the original and altered lymphoma cells multiplied at the same rate. Losing surface molecules did not take away the tumor’s ability to live and divide. In the second stage, after the lymphoma cells were injected into ordinary mice, the variants met different fates: the original lymphoma cells grew into a new tumor, while cells with low MHC-I died and did not establish new lesions. In the third stage, the researchers suppressed NK-cell activity. The previously rejected variants then began forming tumors again.

Ljunggren H.-G., Kärre K. Host resistance directed selectively against H-2-deficient lymphoma variants. Journal of Experimental Medicine, 1985.

This principle became known as missing self. Normal MHC-I molecules send an inhibitory signal to an NK cell; as their numbers decline, that inhibition is lost. Today, we know that activating signals, including signs of cellular stress, also matter for NK-cell activation. But the direction of Kärre’s thinking has endured. The immune system can detect a disturbance through the disappearance of something that ought to be present.

The two branches of defense looked at the same surface in different ways. A T lymphocyte read the peptide on display; an NK cell took account of whether normal identification molecules remained. For a tumor lineage, these requirements made uncomfortable neighbors. Hiding from one means of detection could mean becoming more vulnerable to another.

Two Hundred Days

The mechanisms we have found let us picture the destruction of a dangerous clone: recognition, assembly of the response, arrival of lymphocytes, and cell death. But what was happening where no growing tumor could be seen?

The Glasgow donor’s story shows that cells with malignant potential could persist after sixteen years without clinical signs of melanoma. It raises a question: had the immune system been keeping them in check all that time?

Catherine Koebel and her colleagues modeled such a situation. They gave ordinary mice a small dose of the carcinogen 3-methylcholanthrene. Some animals developed growing sarcomas. The others remained under observation. Two hundred days passed, more than half a year. Some mice still had no detectable tumor; in others, a small, stable mass remained at the injection site.

On day 200, the researchers began giving one group a control immunoglobulin that did not affect immunity, and another group antibodies against lymphocytes. In effect, they switched off several important components of immune control. They did not give the carcinogen again. After this intervention, growing tumors appeared in seven of fifteen mice in the second group, compared with one of thirteen in the control group.

What happened forced a new reading of the preceding two hundred days. At least some of the animals had harbored a population capable of growing all along. Its presence became visible once the defenses were removed.

Cells taken from small, stable masses produced progressive tumors when transferred into immunodeficient mice. The long period of quiet had not made them safe. Within the masses themselves, researchers found fewer signs of cell division, more signs of cell death, and more T lymphocytes than in growing sarcomas. Together, these results supported a picture of dynamic equilibrium: the immune response was holding the tumor population’s growth in check.

After two hundred days of apparent quiet, another outcome of immune defense had emerged: it could contain a dangerous population without destroying it completely. This kind of work is easy to miss if total destruction of the enemy is the only thing that counts as victory.

For an evolving tumor, this meant that acquiring the ability to multiply was not enough. Its descendants also had to survive the pressure exerted by the surrounding organism. The lineage’s fate depended on whether it could produce more living cells than it lost. The immune system was part of that calculation.

Back to Glasgow

Now let us return to the donor. The kidney transplant replayed Koebel’s experiment in a human body, without the design or the controls. To allow the kidneys to take, the recipients were given drugs that suppressed their immune responses. The defenses were removed, much as antibodies had removed them on day 200, and melanoma grew within months.

In the second recipient, immunosuppression was withdrawn and interferon, which itself strengthens the immune response, was prescribed. After thirteen weeks, signs of rejection appeared. The kidney was removed, and extensive masses of dead melanoma cells were found inside it. Two years after the melanoma was detected, the man was alive and had no clinical signs of a tumor. When the guards returned, they began killing again.

MacKie R. M. et al. Fatal Melanoma Transferred in a Donated Kidney 16 Years after Melanoma Surgery. New England Journal of Medicine, 2003.

A single case cannot prove that the immune system was what held the melanoma in check for sixteen years. But the laboratory findings fit that interpretation. Those sixteen quiet years were not empty. This defense had no witnesses because it was doing its job.

The Student’s Voice

On December 7, 2011, Michel Nussenzweig delivered the Nobel Lecture on dendritic cells. He was the same student who had helped Steinman show that a tiny fraction of spleen cells did the crucial work. Now he was telling the story of the discovery on his teacher’s behalf.

Ralph Steinman himself had died of pancreatic cancer three days before the Nobel Prize was announced. The disease had been diagnosed four years earlier. Steinman was treated with surgery, chemotherapy, and experimental immunotherapy based on dendritic cells that he had developed himself. We cannot say what role each part of the treatment played, but four years was a relatively long time for pancreatic cancer, especially then.

Alongside his story stand two others. Remember the two patients Alexander Knuth and Thierry Boon had worked on? MZ-2 and A.V. lived for more than thirty years without their disease returning. The researchers themselves linked this to the strong and diverse T-cell responses in both patients.

The body has defenses that keep working after the internal brakes of its cells have failed. These defenses receive information about what is inside cells, notice the loss of normal features, assemble a response, and destroy their targets. Sometimes, all their work leaves behind is the absence of a growing tumor.
Publications in 2026

In 2026, I am leading the Bioinformatics Department at BostonGene. In addition to our core work — client projects — we run a small research program within the department to deepen our expertise in oncology and build expertise in other areas, such as autoimmune diseases. This year, I led one complete research project; on the others, I served as a mentor and oversaw quality control.

American Association for Cancer Research

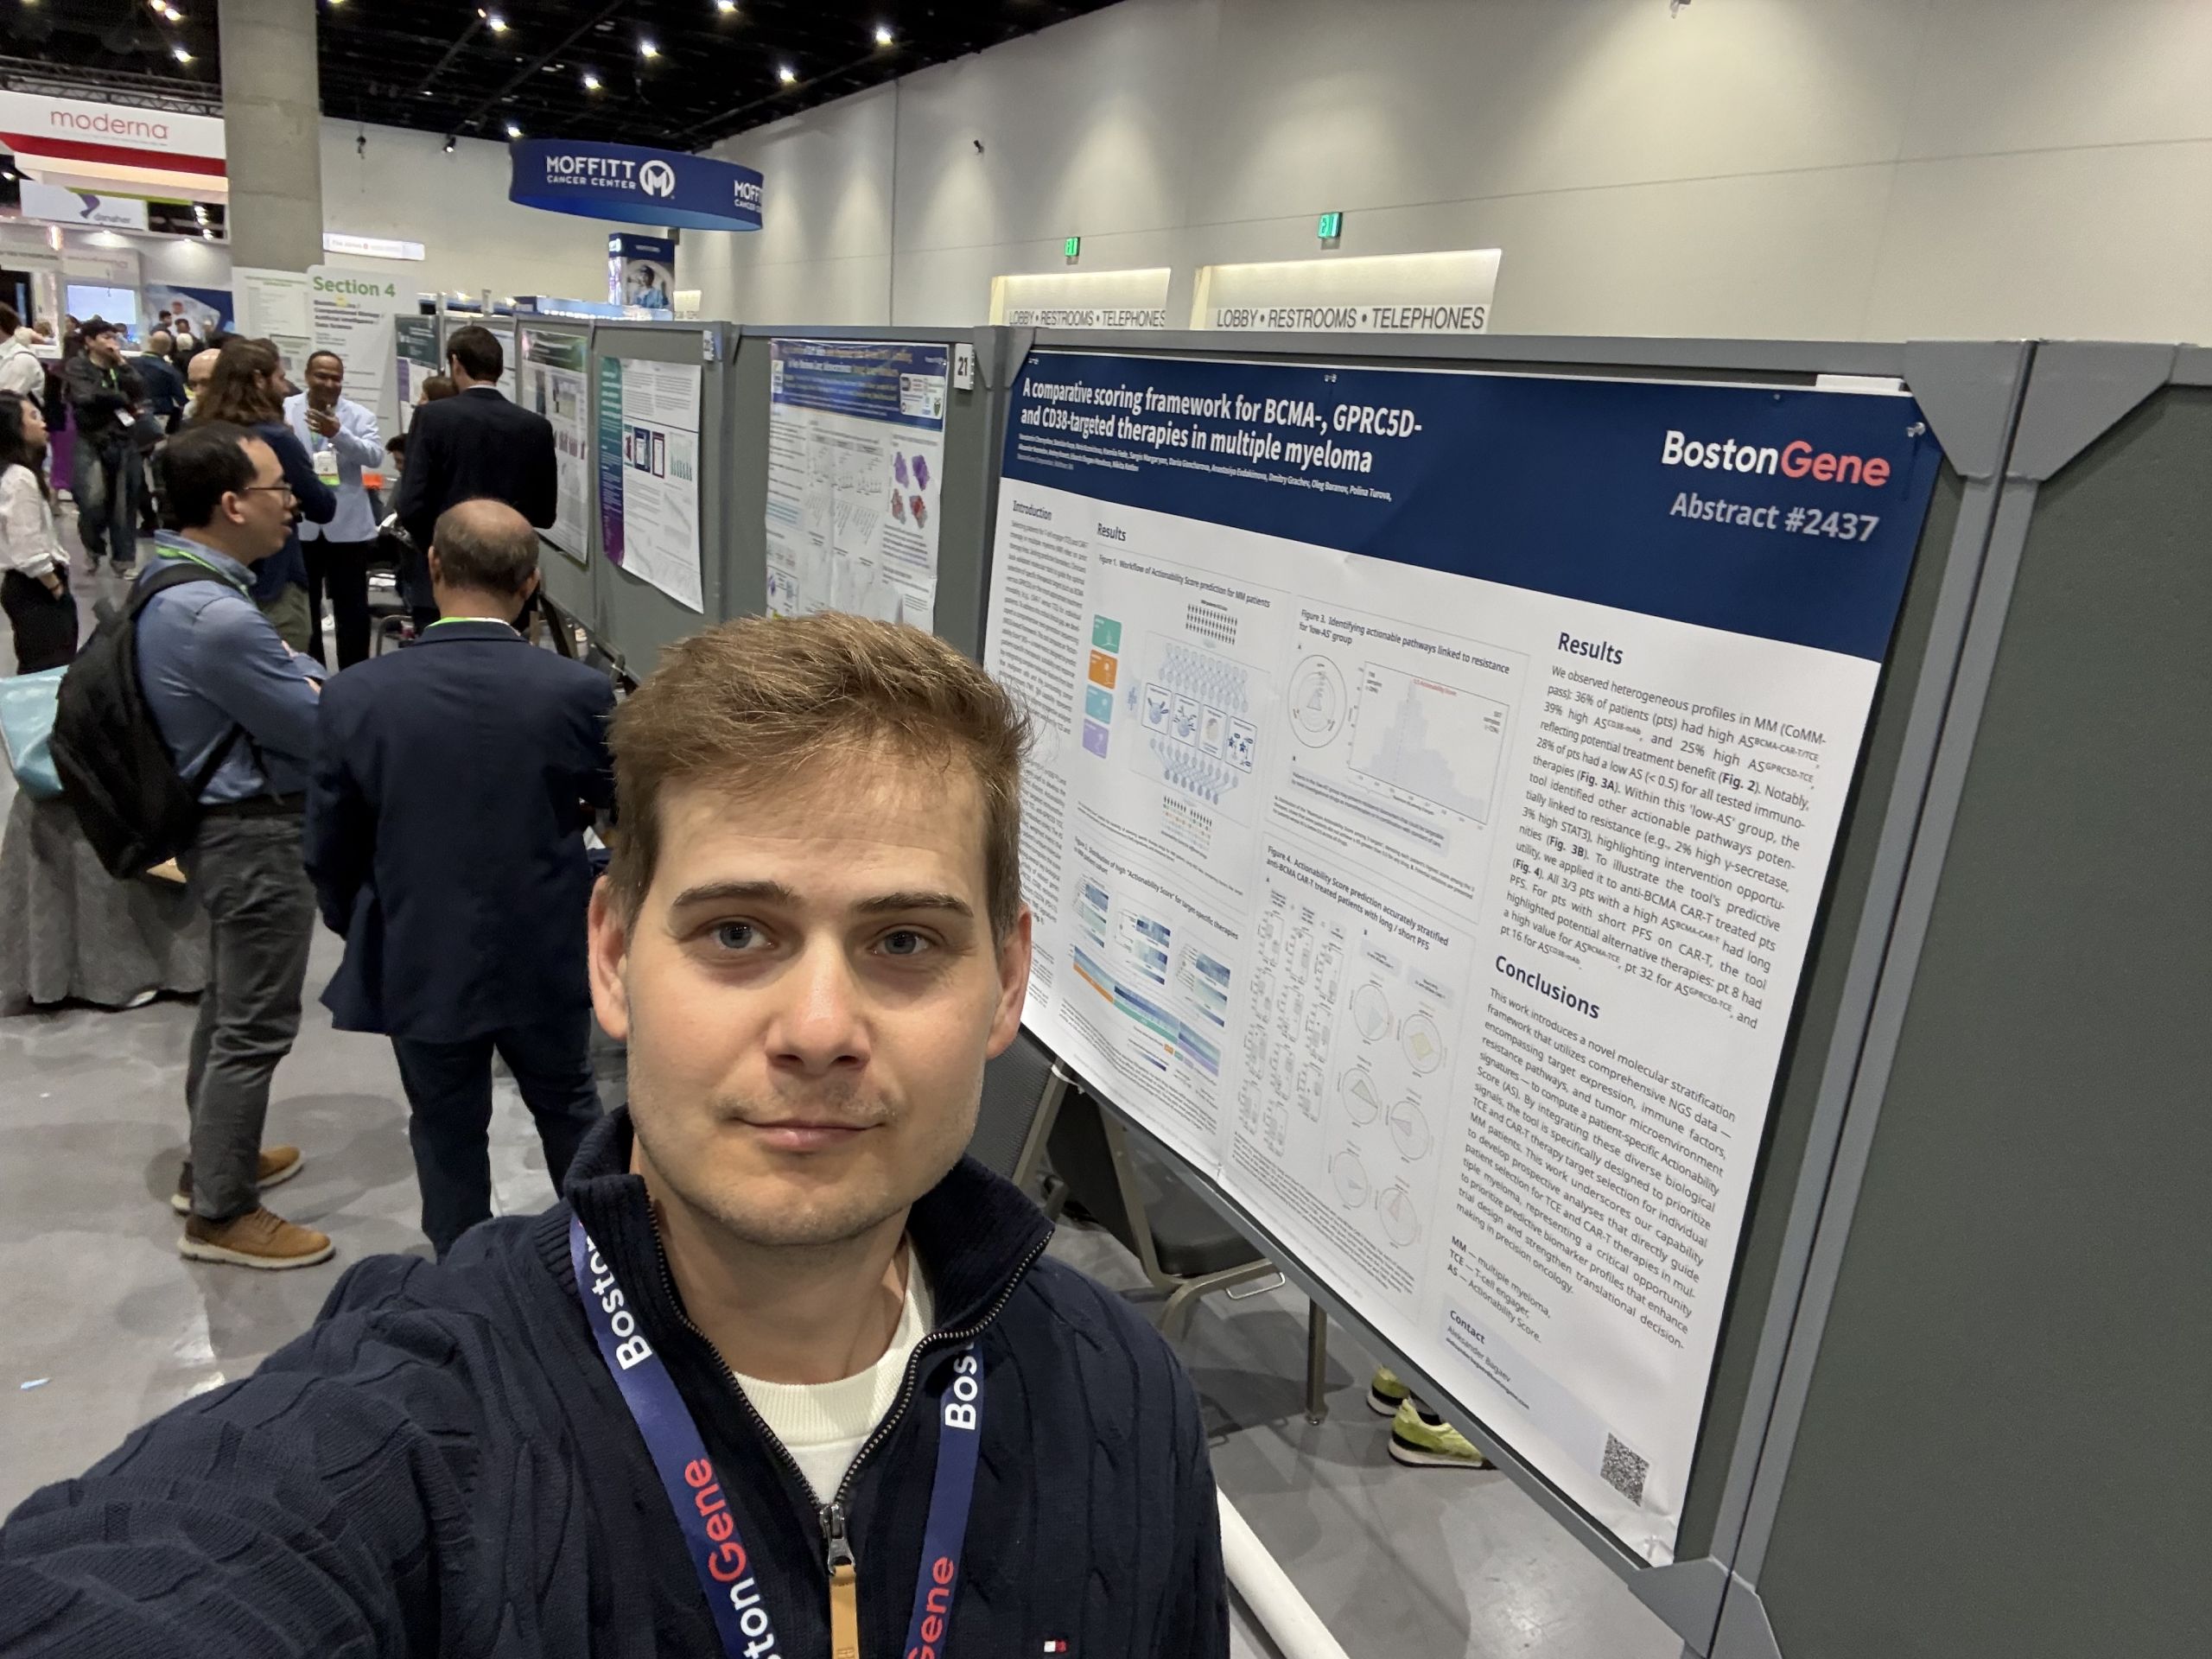
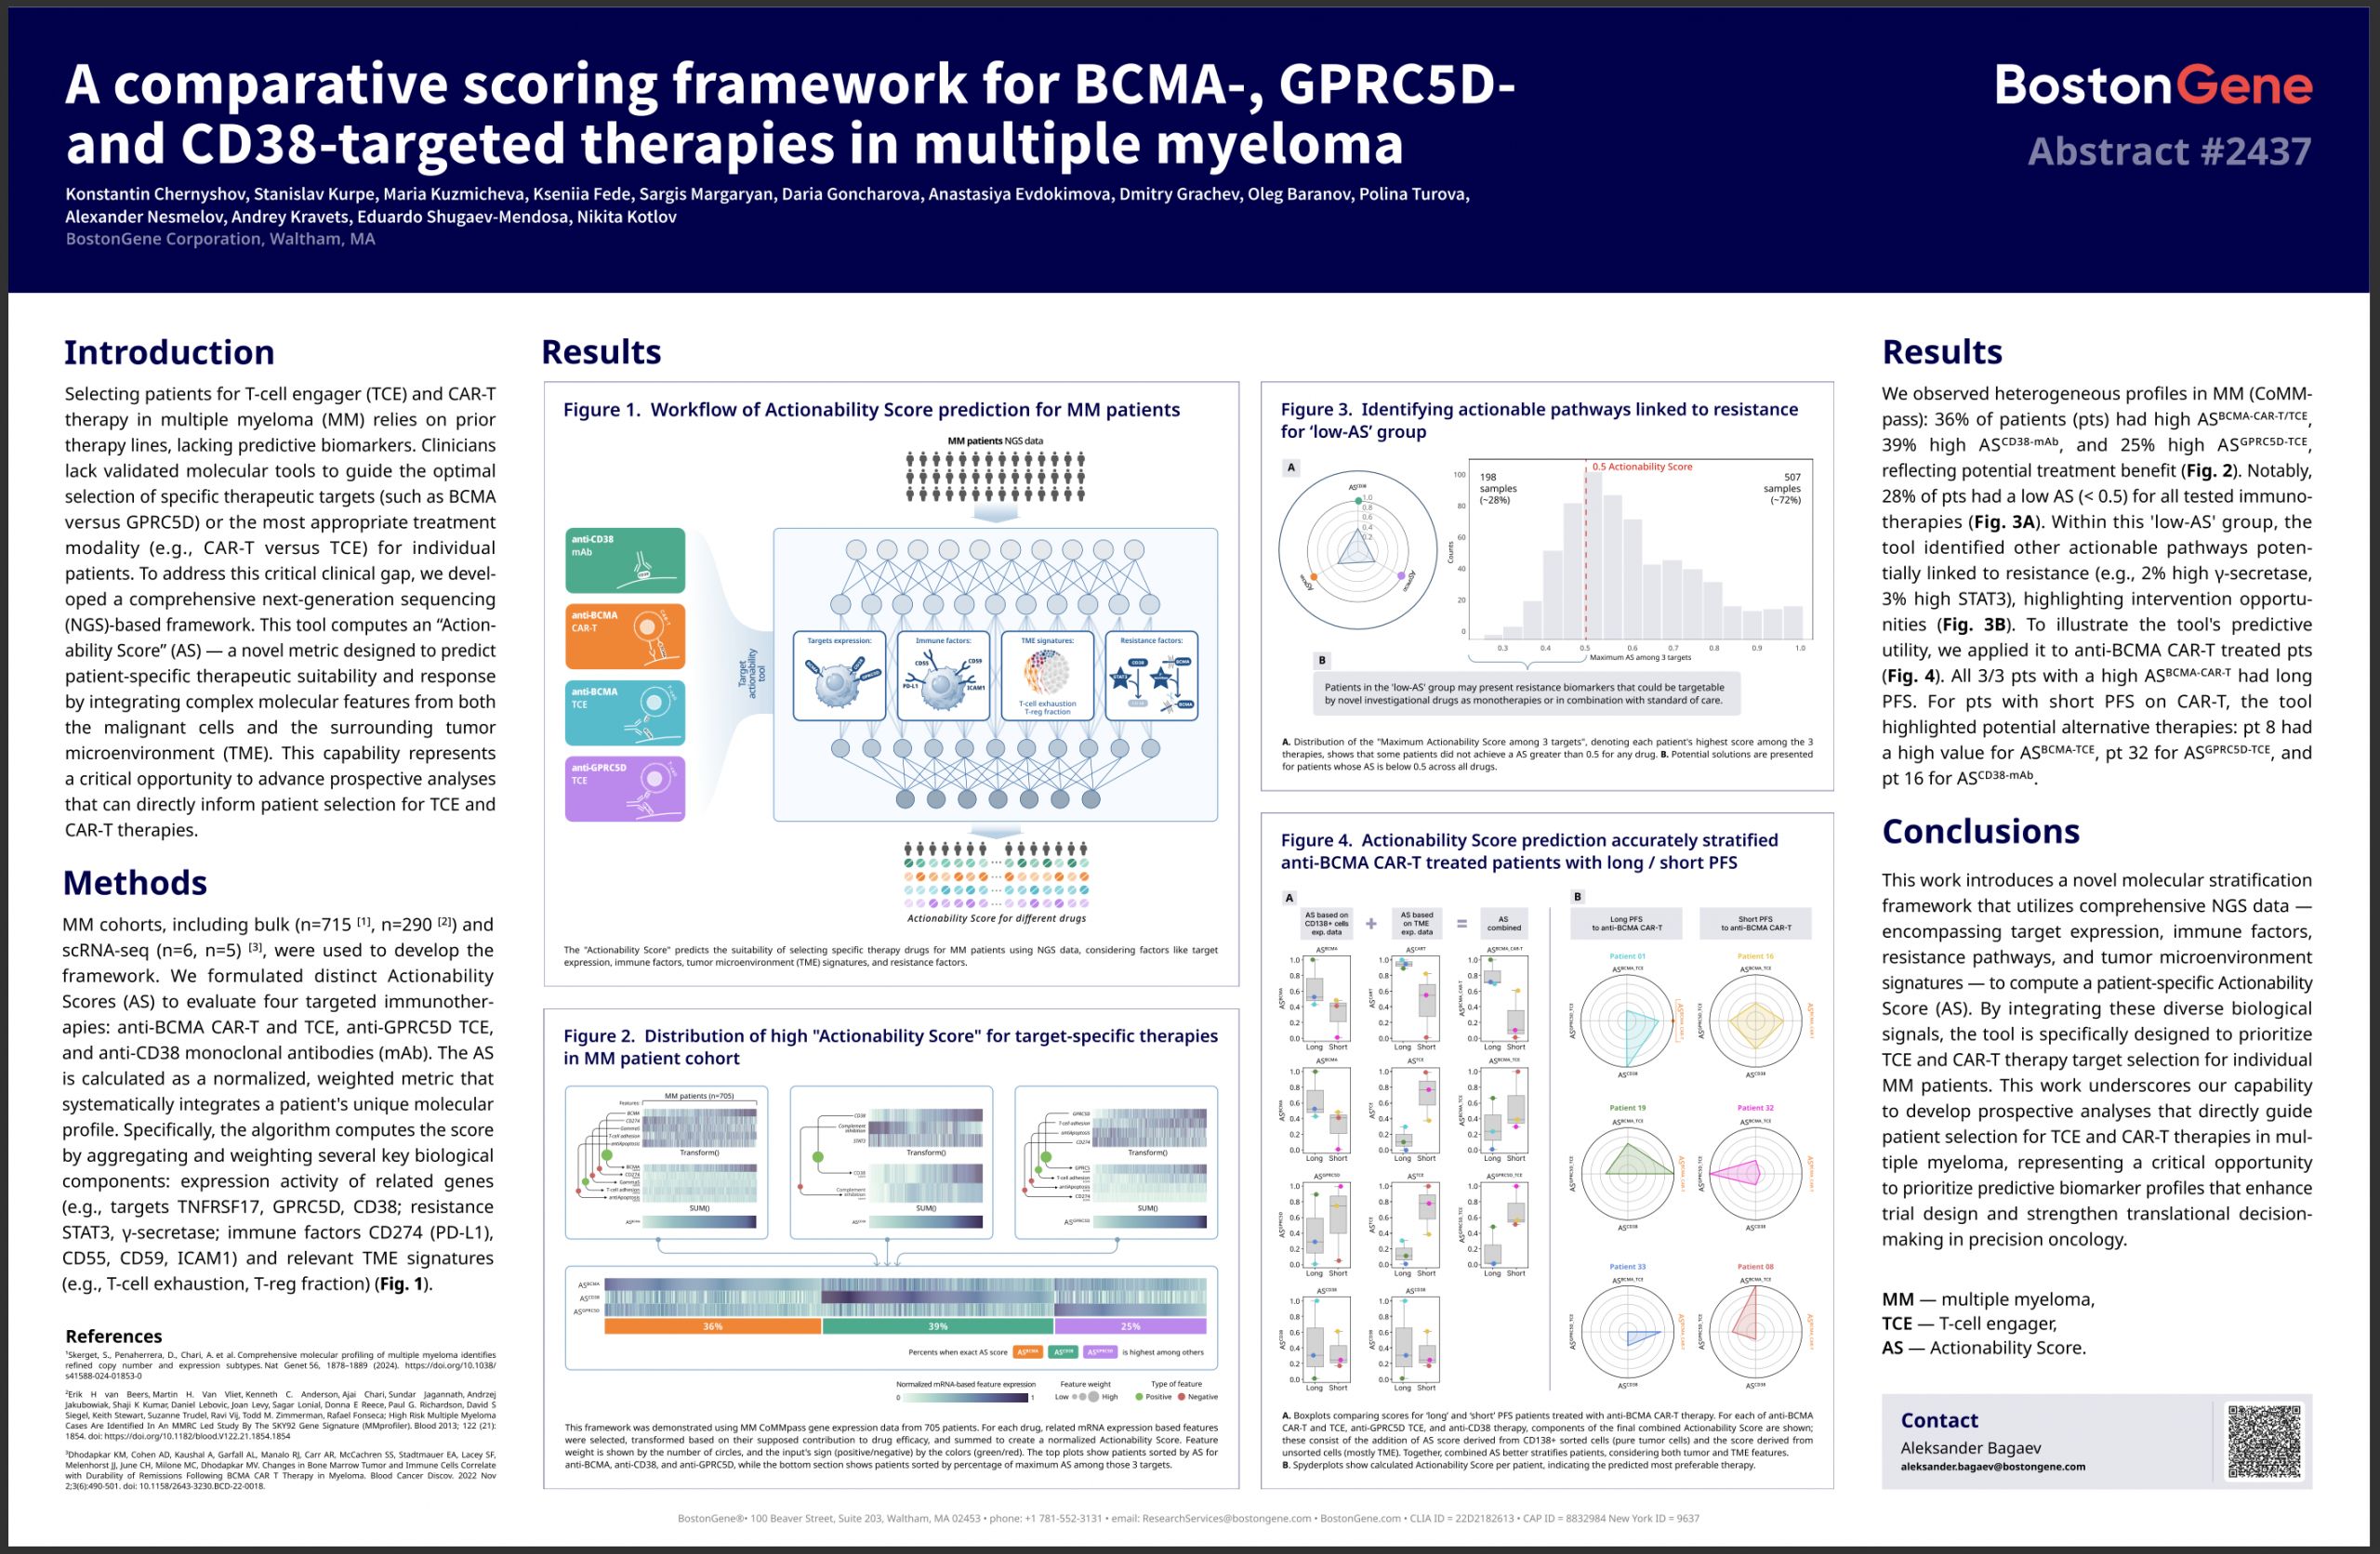
“A comparative scoring framework for BCMA-, GPRC5D- and CD38-targeted therapies in multiple myeloma”

I am the first author here: I came up with and substantiated the idea, designed the experiments, assembled the team, delegated parts of the work, pulled the results together, designed the visualizations, wrote the text, and presented the study at the conference.

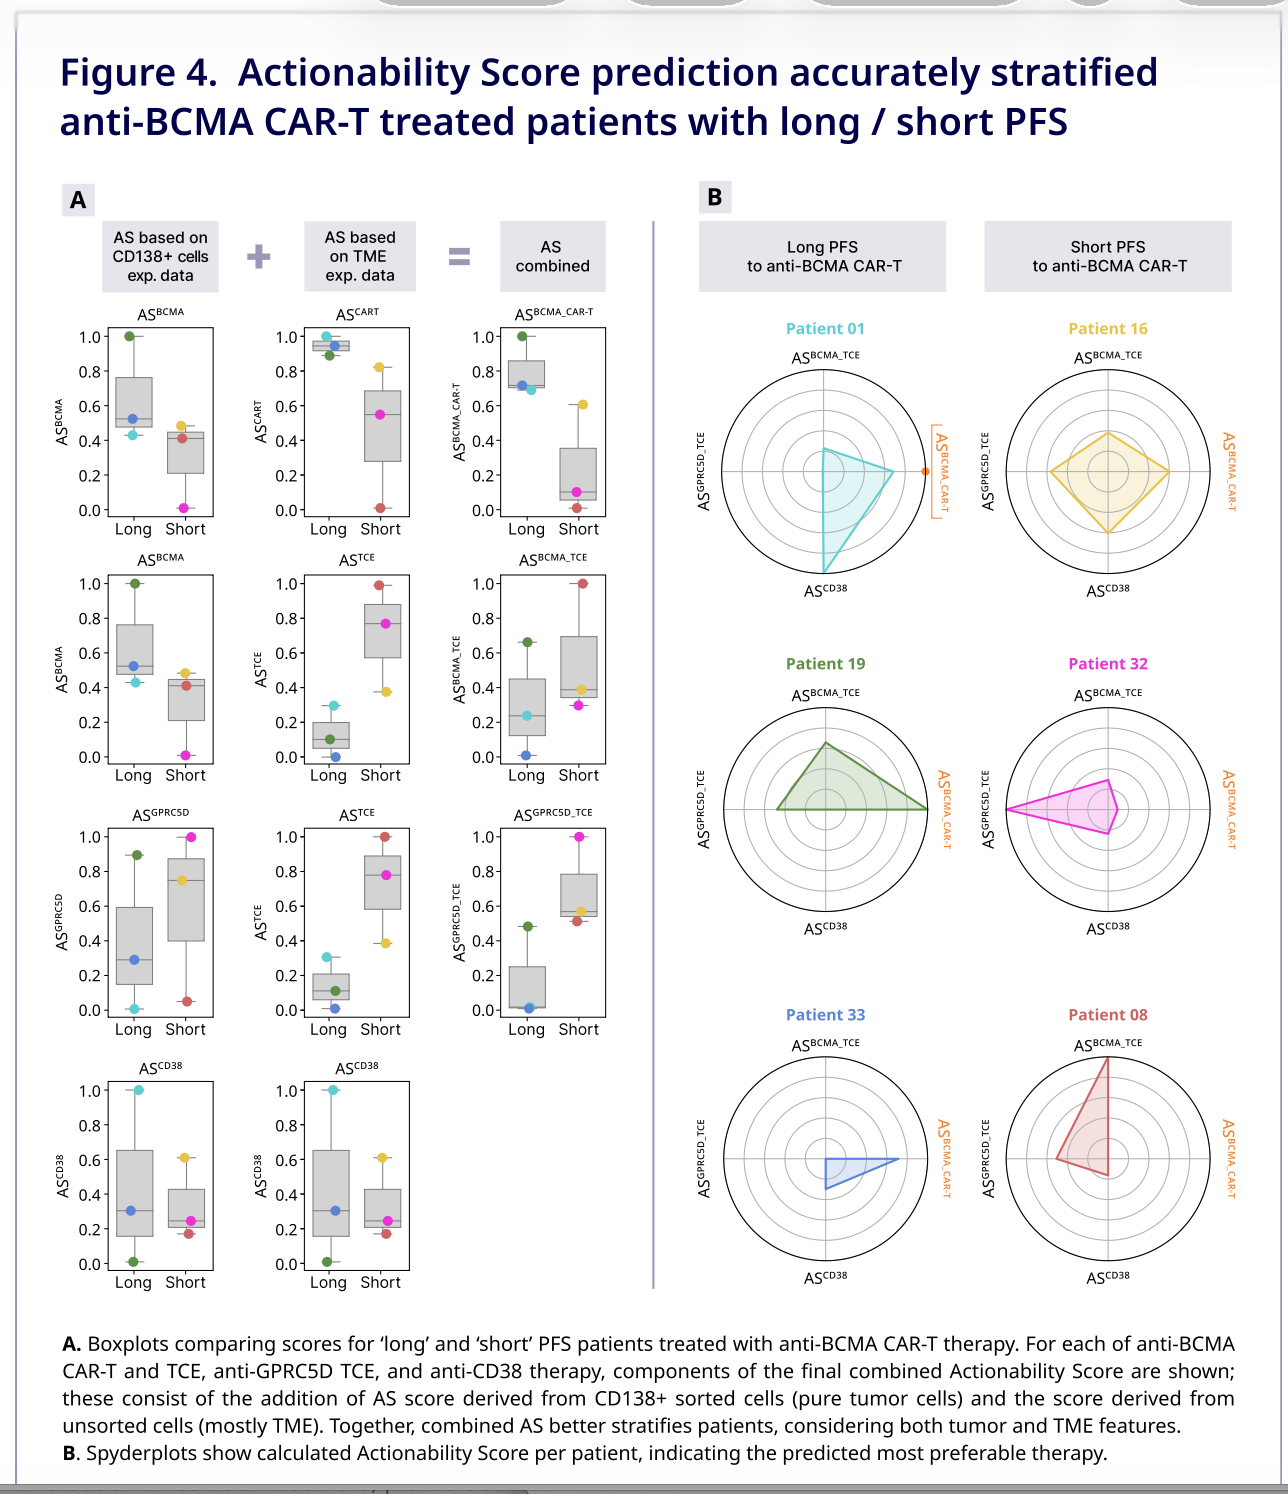
We proposed the Actionability Score — an NGS-based approach for assessing which target and which type of immunotherapy may be best suited for a patient with multiple myeloma: BCMA- or GPRC5D-targeted therapy, CAR-T, a T-cell engager, or an anti-CD38 antibody. The score accounts for target activity, resistance features, and the state of the tumor microenvironment. The results looked promising in a small retrospective cohort, but the approach still needs to be validated in larger cohorts.

Update, 8 September 2026: an updated poster, “An Actionability Score for BCMA-, GPRC5D-, and CD38-targeted therapy selection in multiple myeloma”, is listed in Clinical Lymphoma, Myeloma & Leukemia. It develops the AACR work; I remain the first author. Updated poster and abstract.
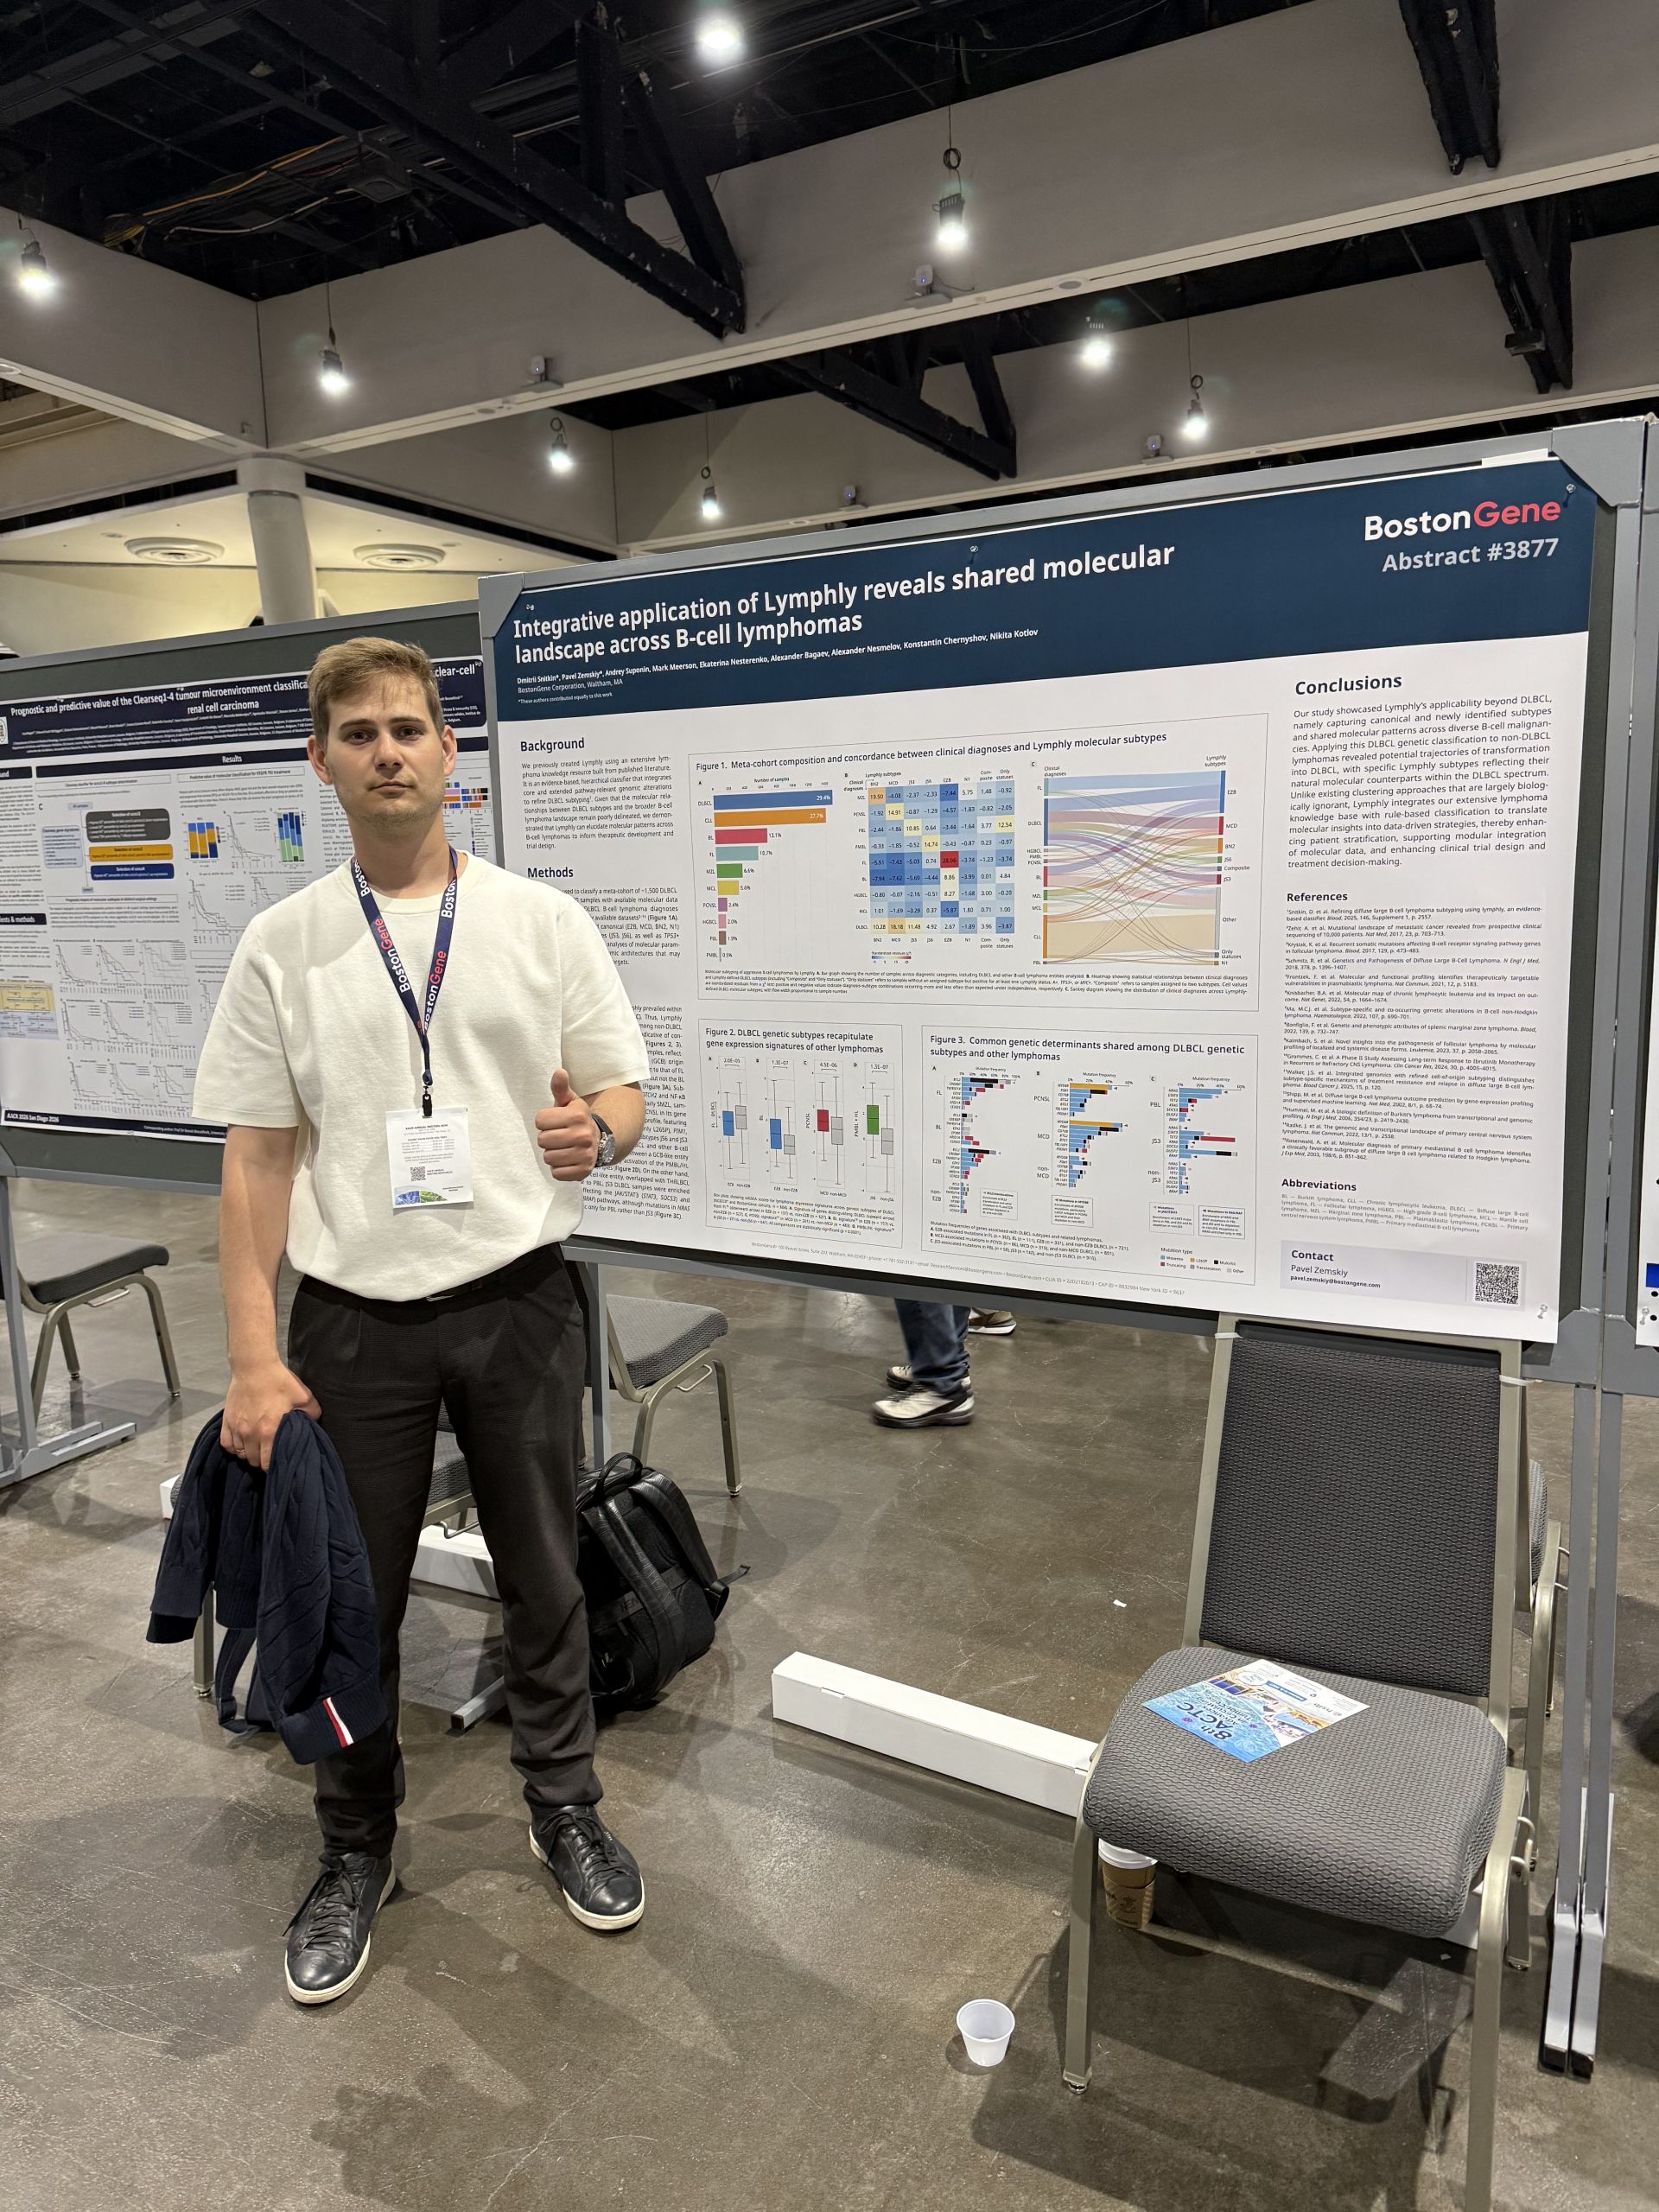
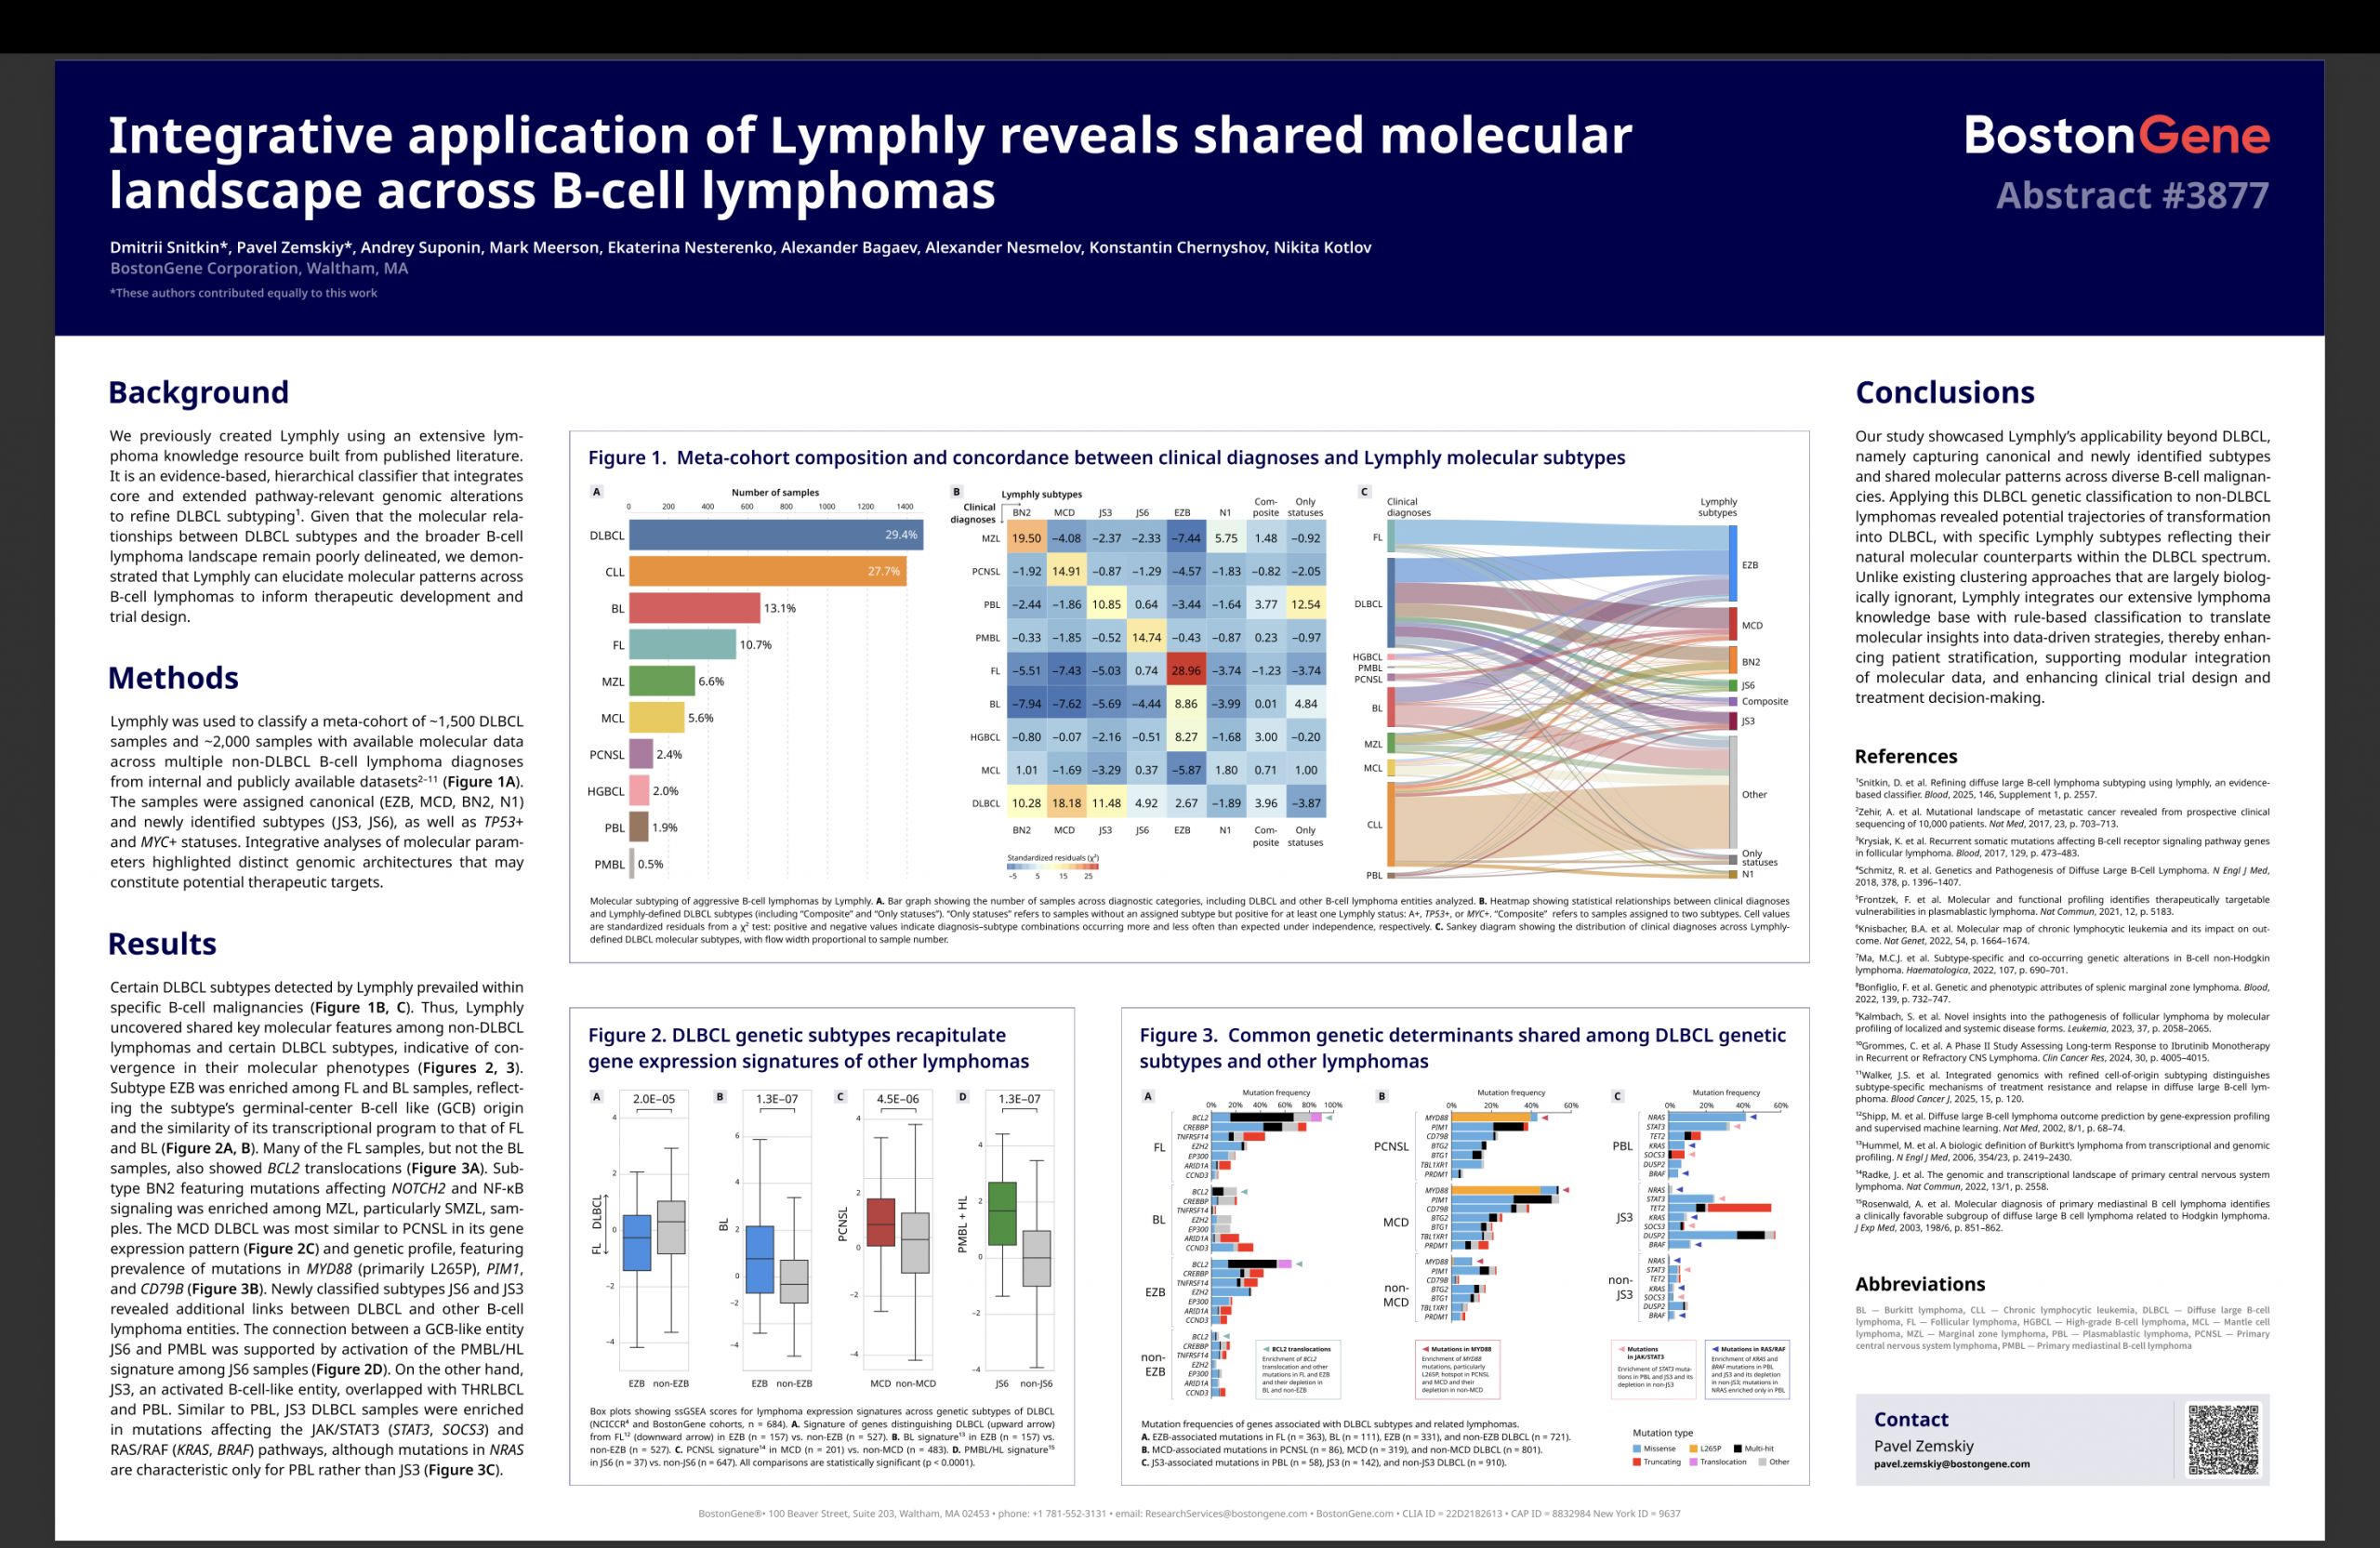
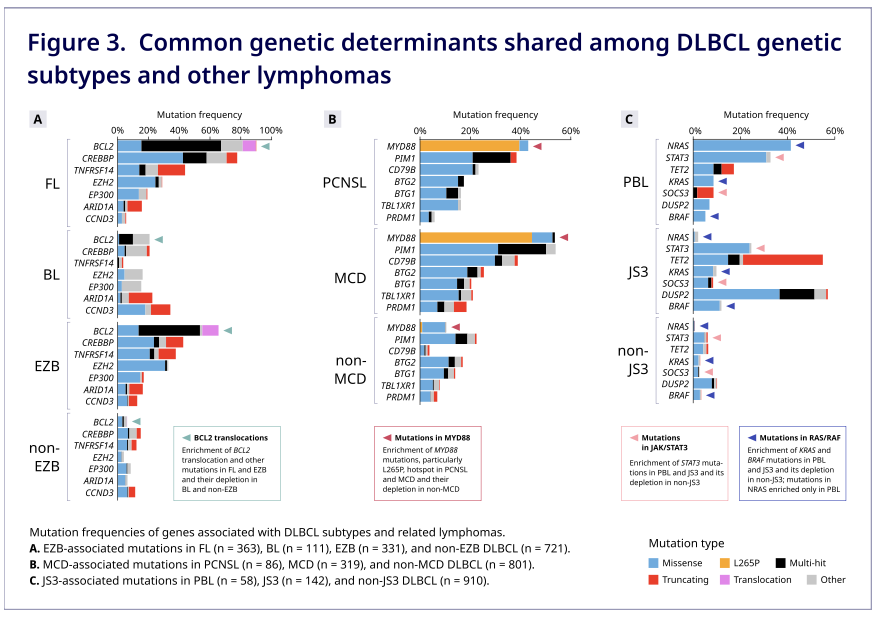
“Integrative application of Lymphly reveals shared molecular landscape across B-cell lymphomas”

Lymphly was originally developed for diffuse large B-cell lymphoma. We applied it to other B-cell lymphomas and found shared genetic and transcriptomic patterns across diagnoses. For example, individual Lymphly subtypes were linked to follicular, Burkitt, marginal zone, and primary mediastinal B-cell lymphomas.

Related work, 8 September 2026: “Cross-disease stratification by genetic classifier Lymphly reveals shared molecular programs across B-cell malignancies”, listed in Clinical Lymphoma, Myeloma & Leukemia. The analysis includes 4,353 DLBCL and 2,203 other B-cell lymphoma samples. I am a co-author. Poster and abstract.
American Society of Clinical Oncology

The main clinical oncology conference in the US.

“Examining the tumor microbiology and microenvironment of patients with triple negative inflammatory breast cancer receiving Keynote 522”

Together with the MD Anderson team, we studied tumor samples from patients with triple-negative inflammatory breast cancer receiving the KEYNOTE-522 regimen. Patients with a pathologic complete response had higher PD-L1 expression and a trend toward greater T-cell abundance. Non-responders showed angiogenic changes; some post-treatment samples showed increased fibrosis or a reduced immune component. The cohort was small, so these observations need further validation. I am a co-author of the abstract.

ASCO abstract on BostonGene.

European Hematology Association

Europe’s leading hematology conference.

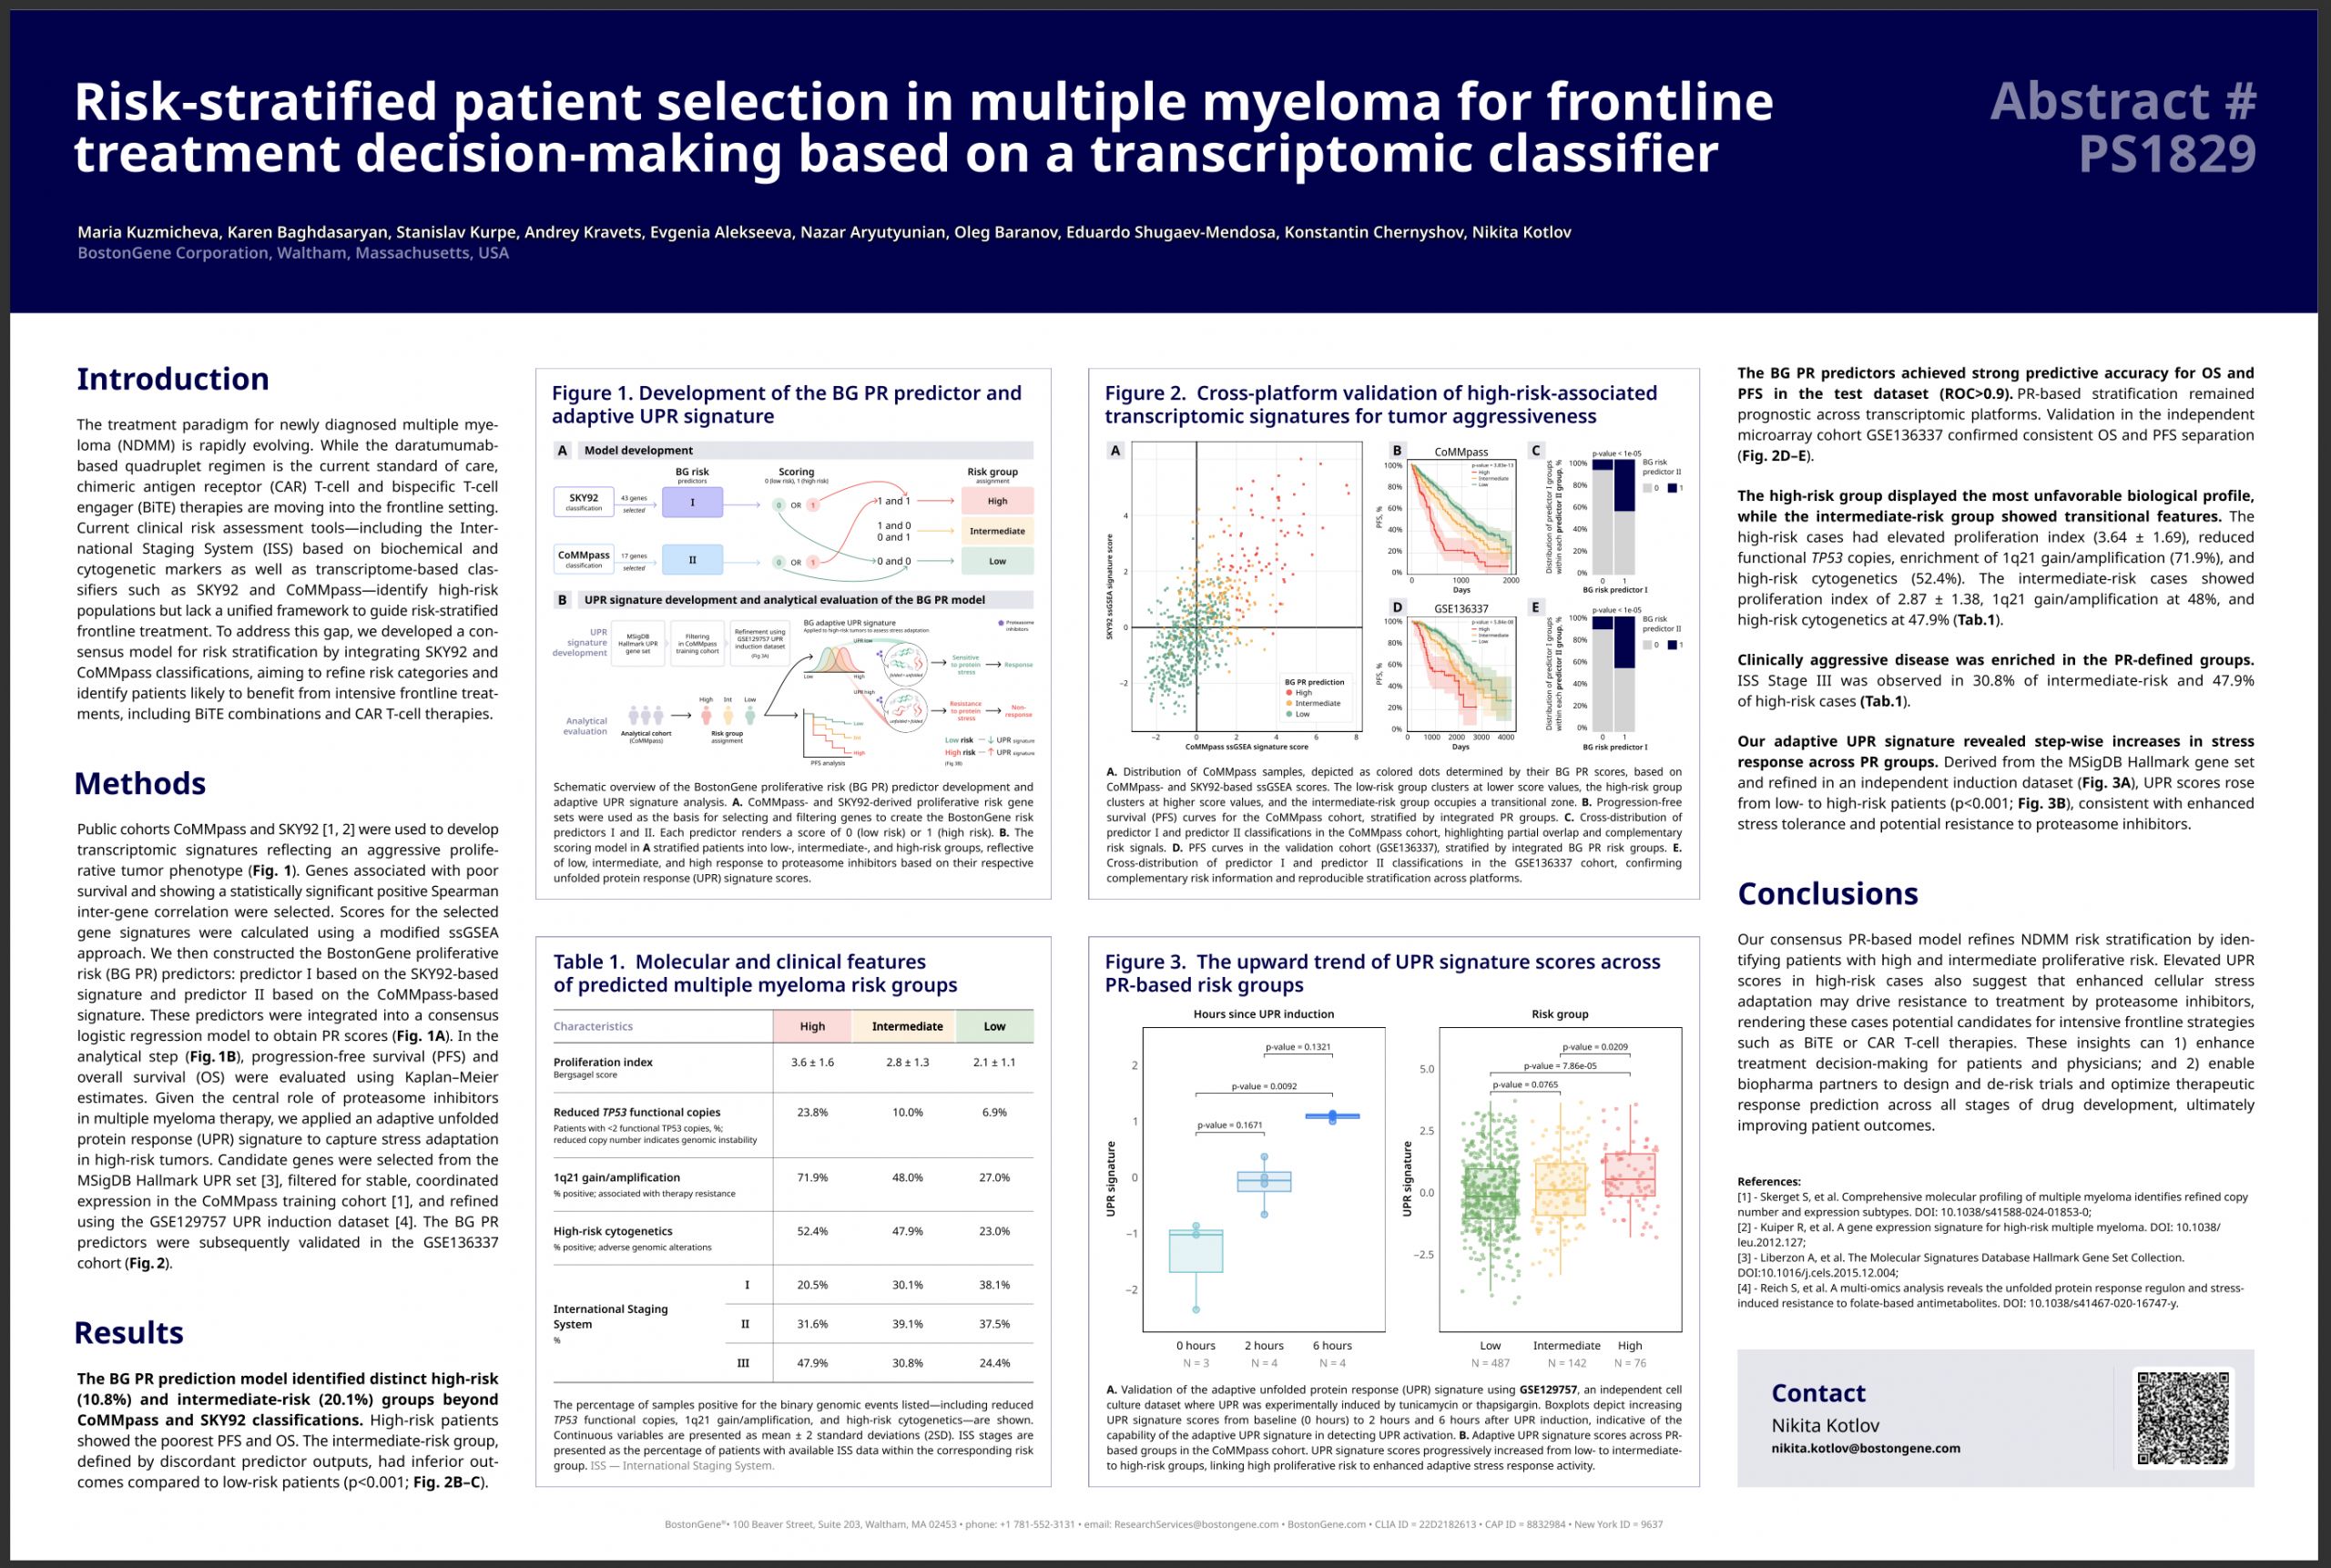
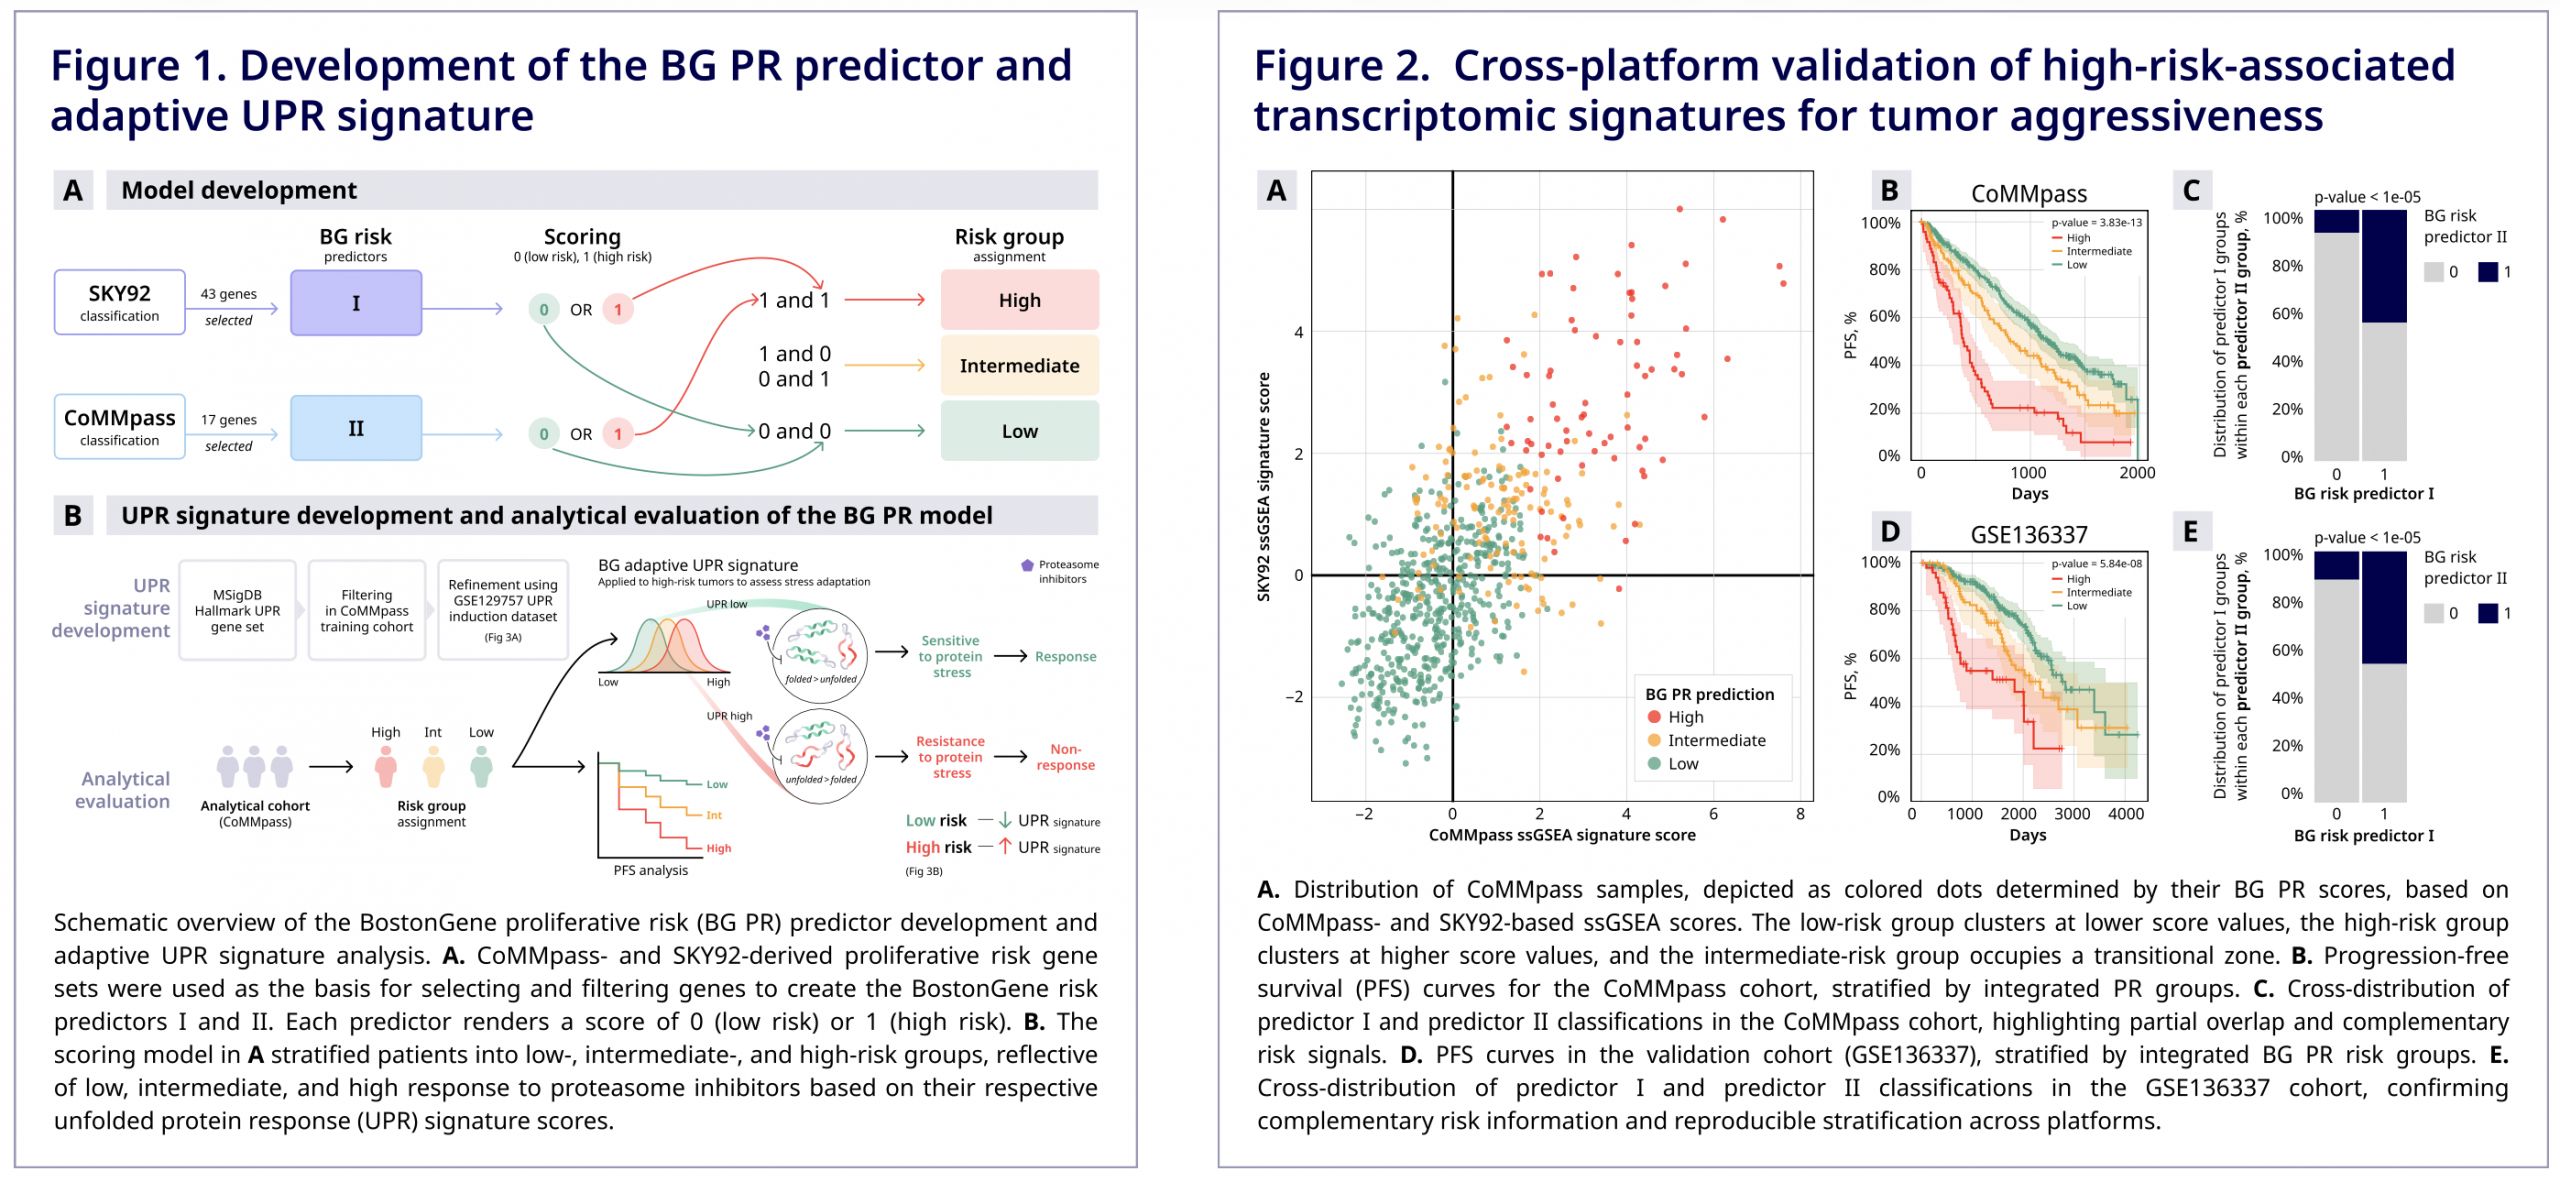
“Risk-stratified patient selection in multiple myeloma for frontline treatment decision-making based on a transcriptomic classifier”

We combined the ideas behind two transcriptomic multiple myeloma classifiers and built a consensus risk model.

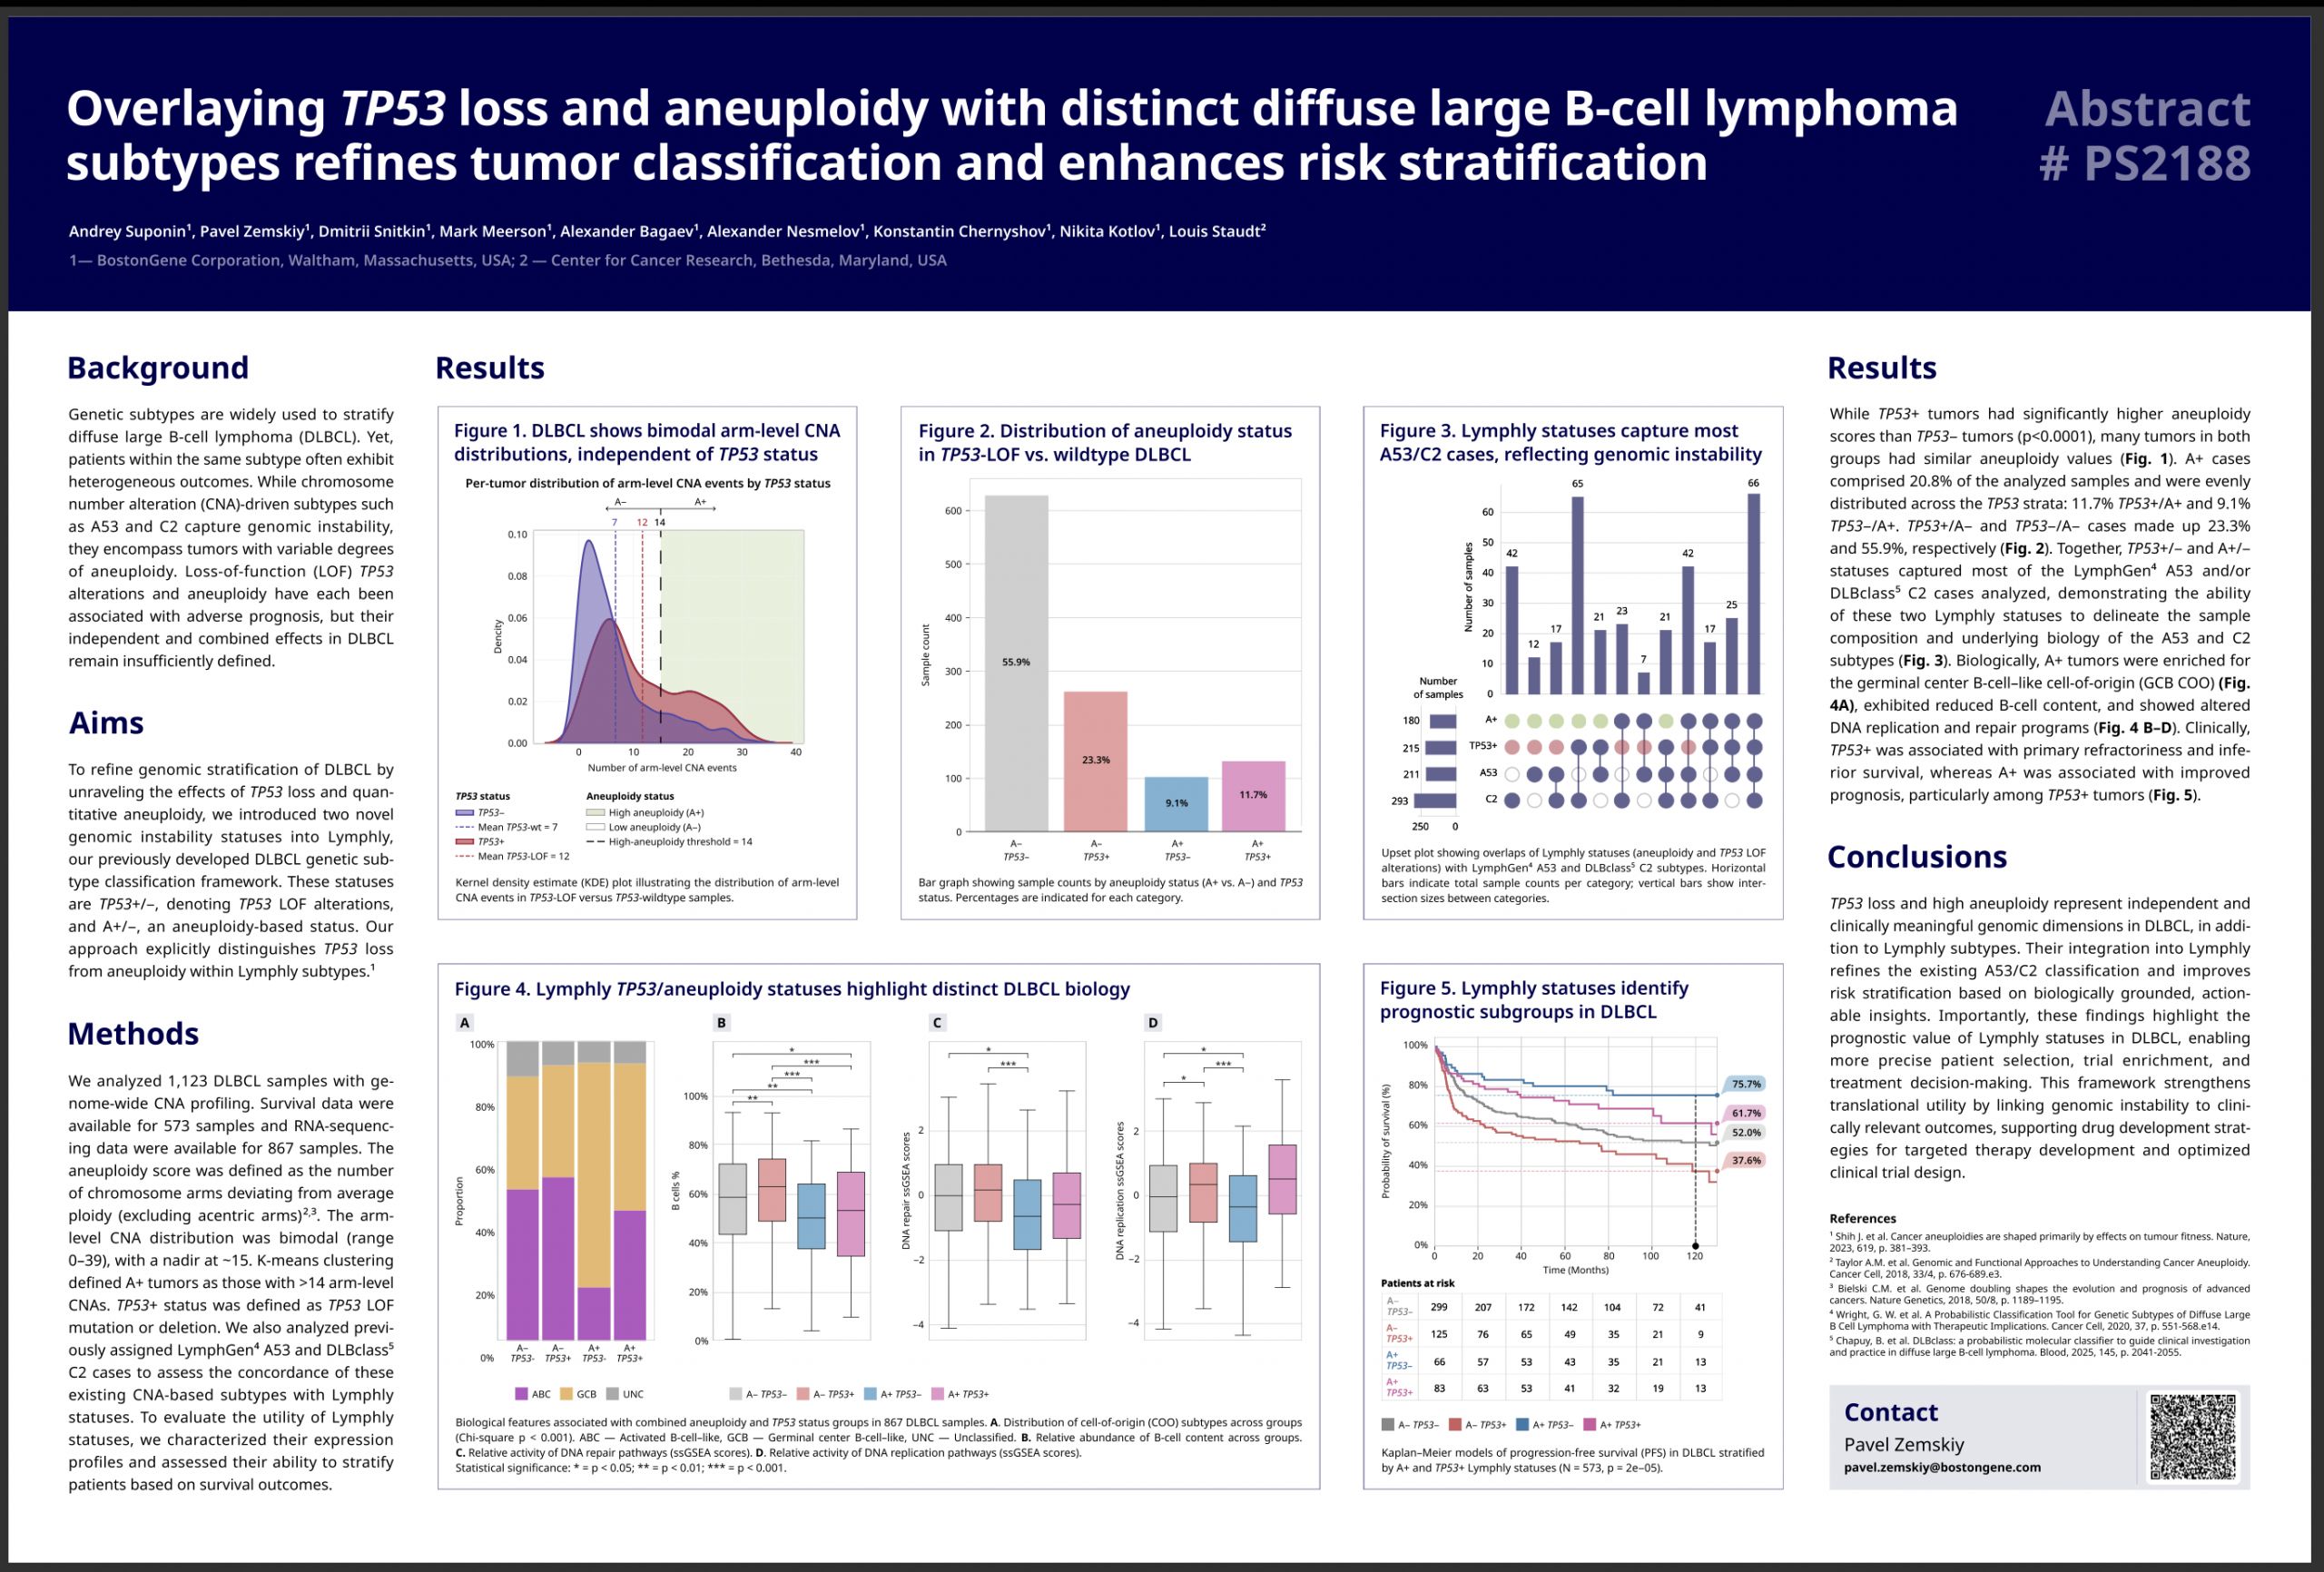
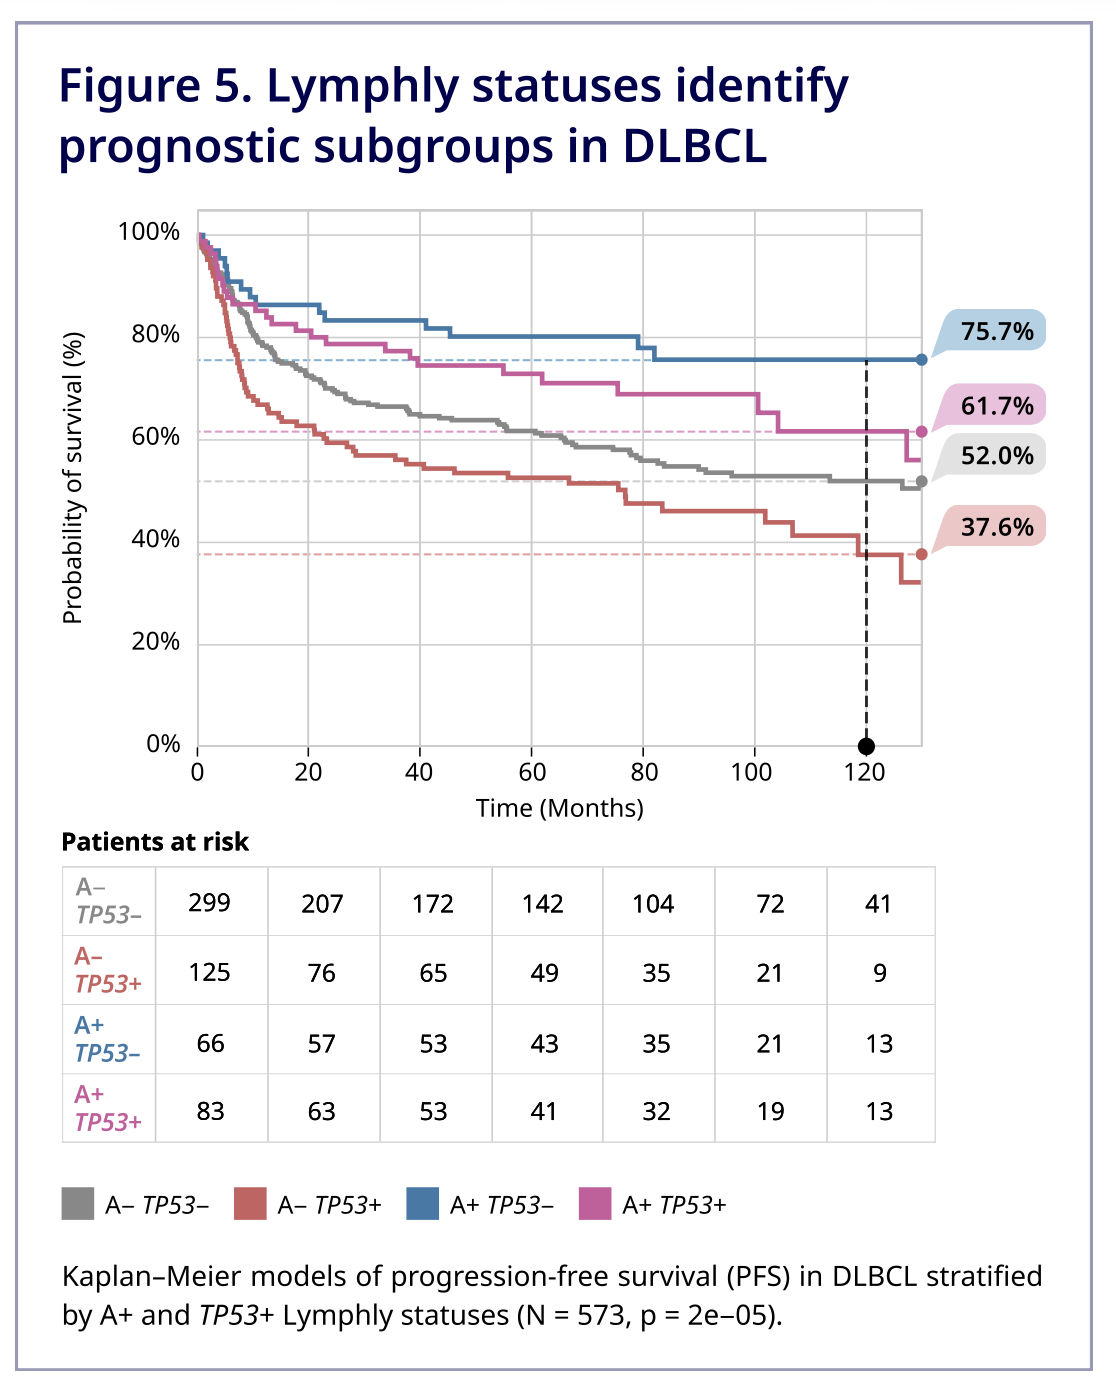
“Overlaying TP53 loss and aneuploidy with distinct diffuse large B-cell lymphoma subtypes refines tumor classification and enhances risk stratification”

We added two independent markers of genomic instability to Lymphly: loss of TP53 function and a quantitative measure of aneuploidy. The really cool result is that patients with aneuploidy but no TP53 loss have the best survival! Their genome is a mess, but the cell’s protective mechanisms are still trying to make it self-destruct.

Bioinformatics Courses in Armenia

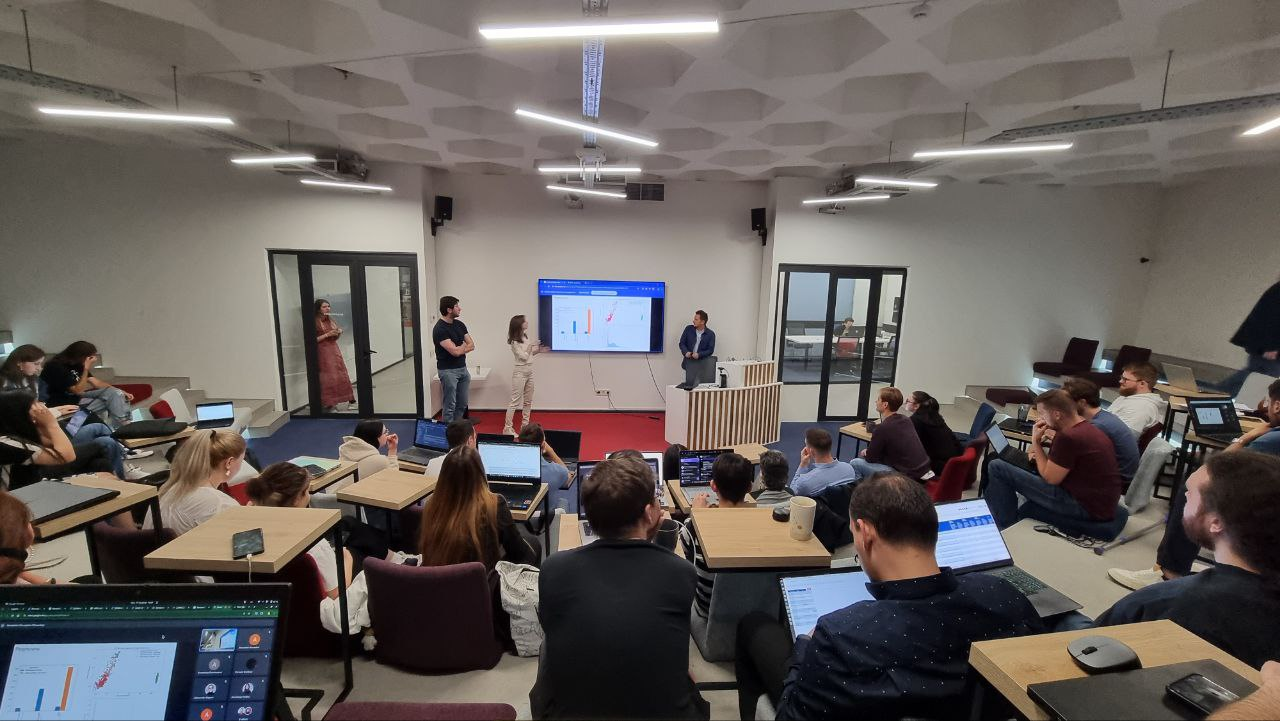
BostonGene together with the Russian-Armenian University launched bioinformatics courses. The goal is to recruit junior bioinformaticians to the company.
There are two tasks:

  1. Creating a selection funnel for new bioinformatics
  2. Having students come to us better prepared so that they can start faster and bring value

Recording of one of the courses on YouTube

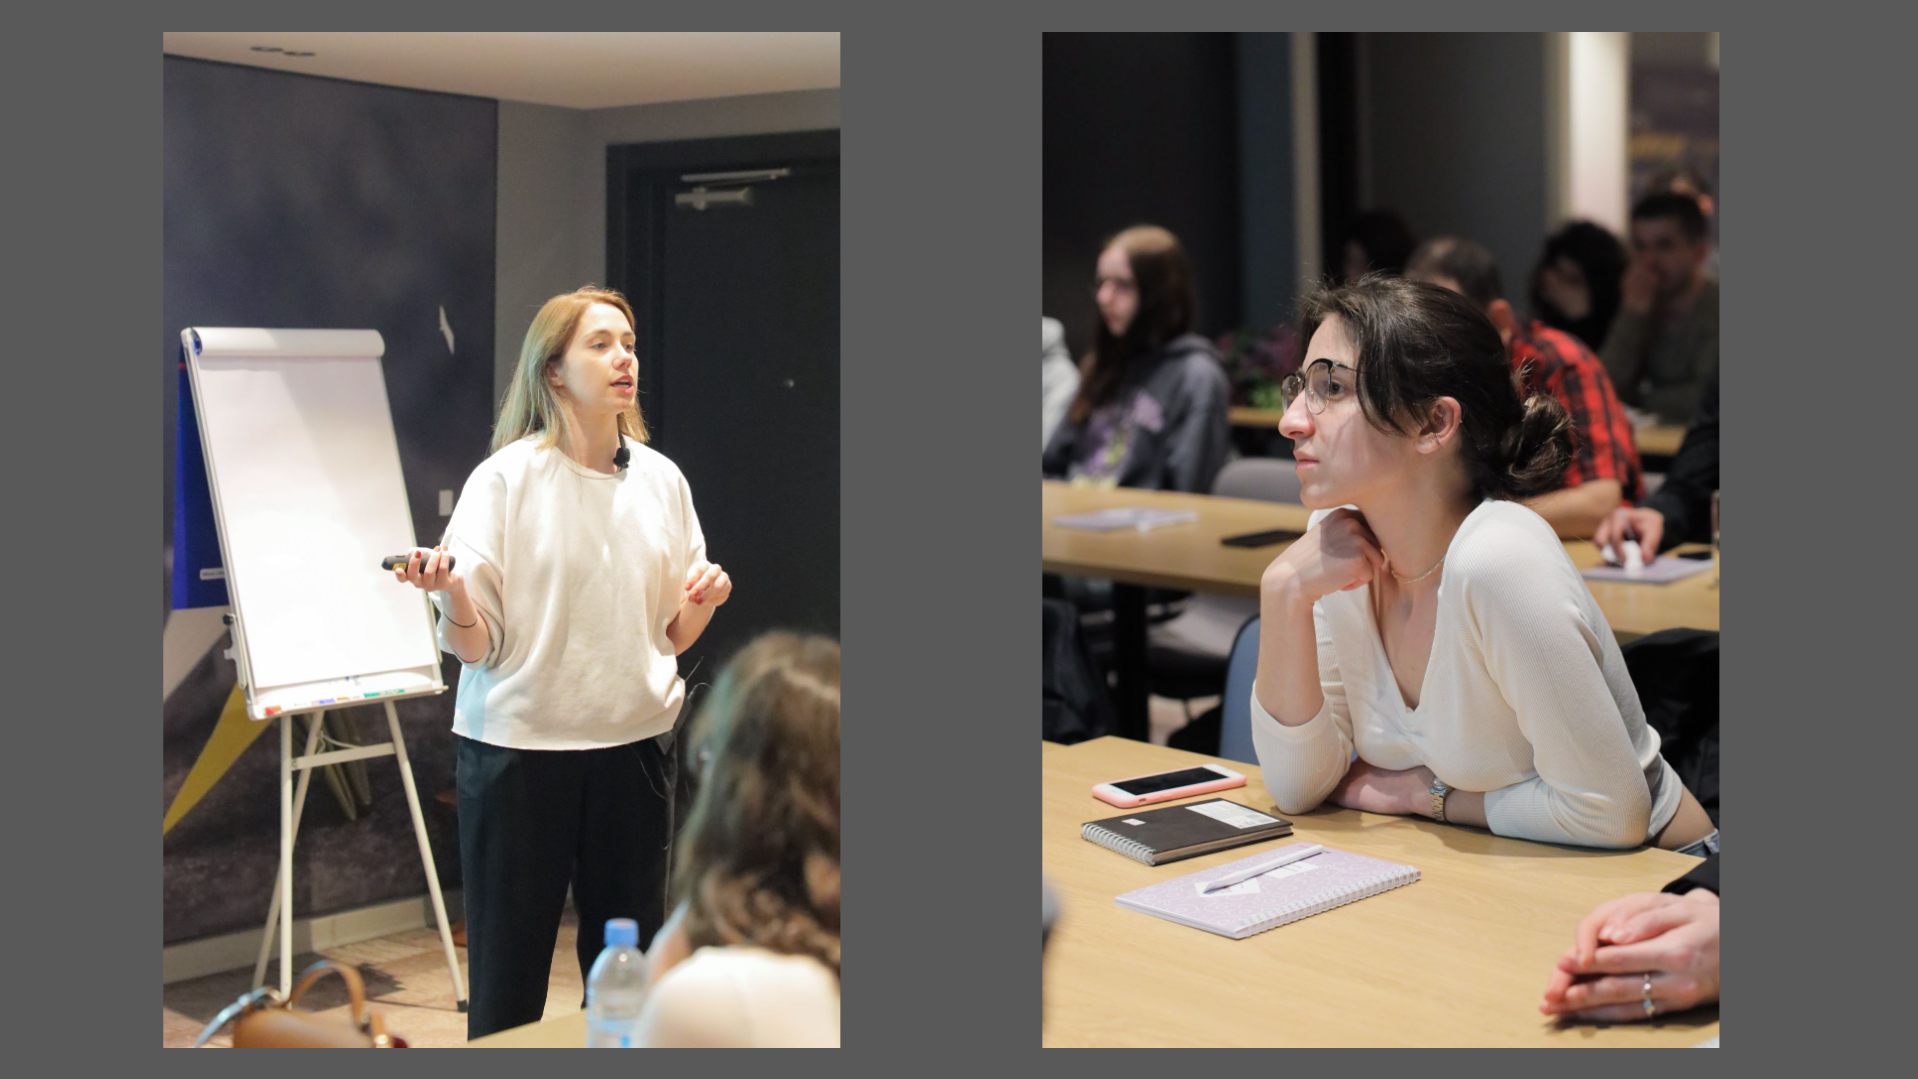
A short spring course in 2023. The first lecture. I give an introductory word, Sasha Livanova talks about biology.

I was responcible for the course program and the set of lectures, selected lecturers, organized the preparation of lectures, homework assignments, projects and exams, and drew up and monitored the lecture schedule and homework deadlines. I communicated with students — coordinated where and when the classes took place, prepared lecture announcements, collected feedback by semester. I did everything except legal matters and budgeting.

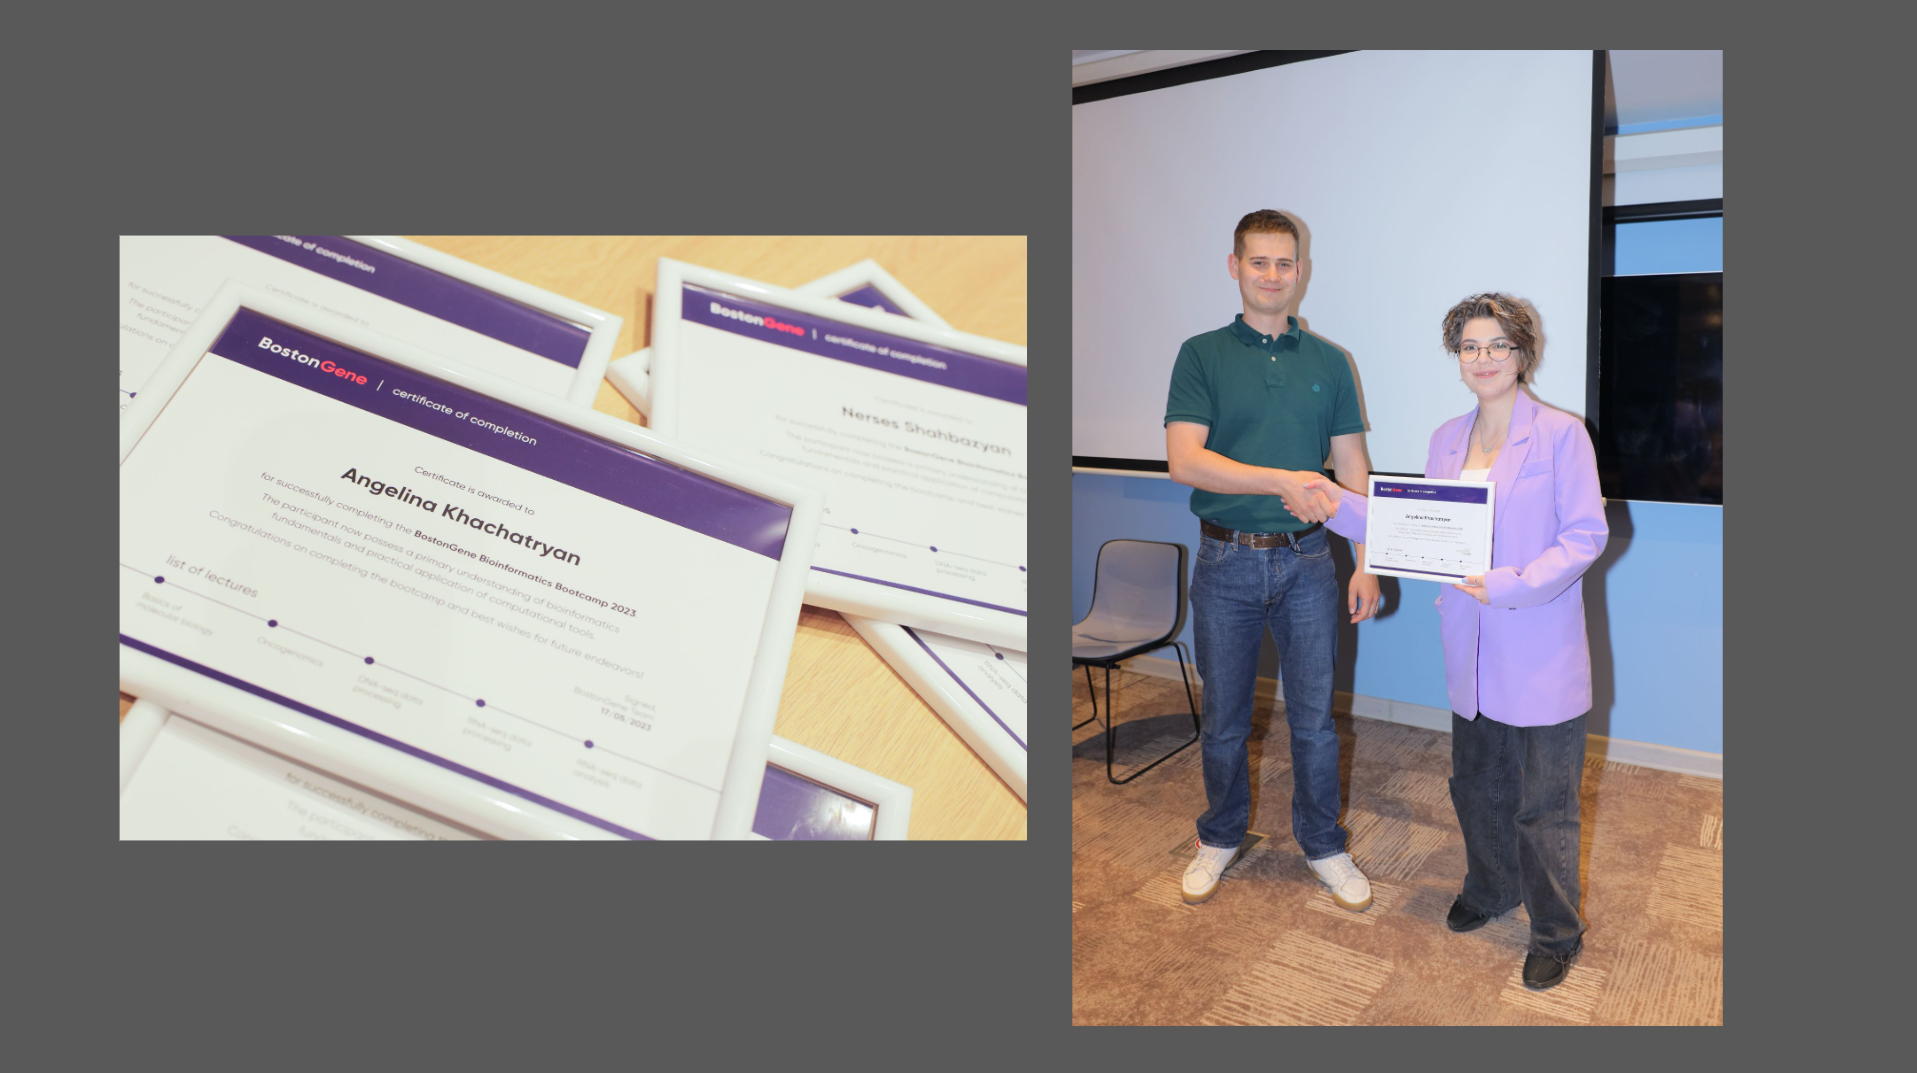
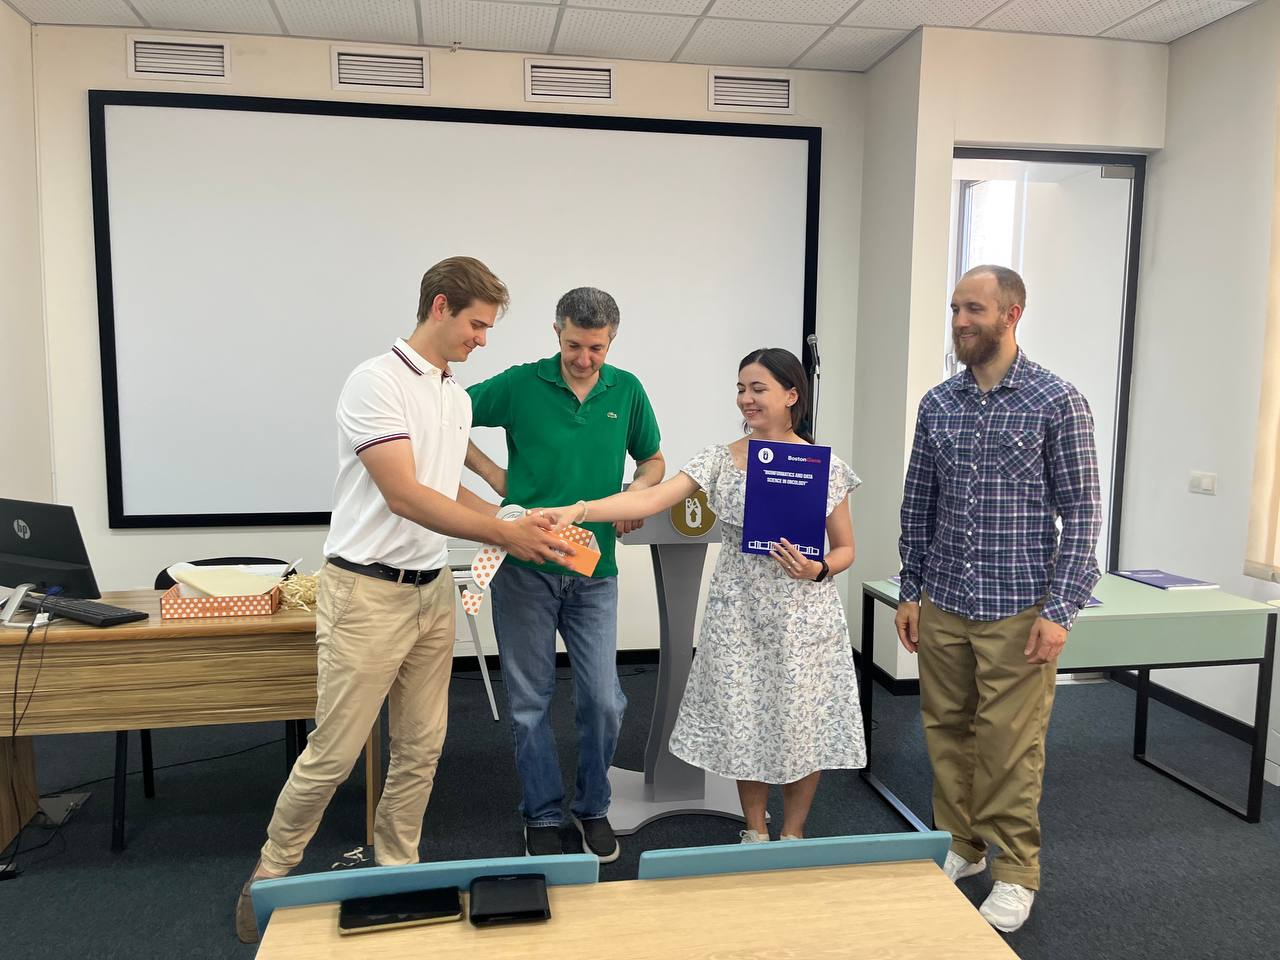
A short spring course of 6 weeks in 2023. Sasha Livanova gives a lecture. I hand out the diploma.
Course 2023–24. Defense of course projects. Students present a classifier for cholangiocarcinoma.
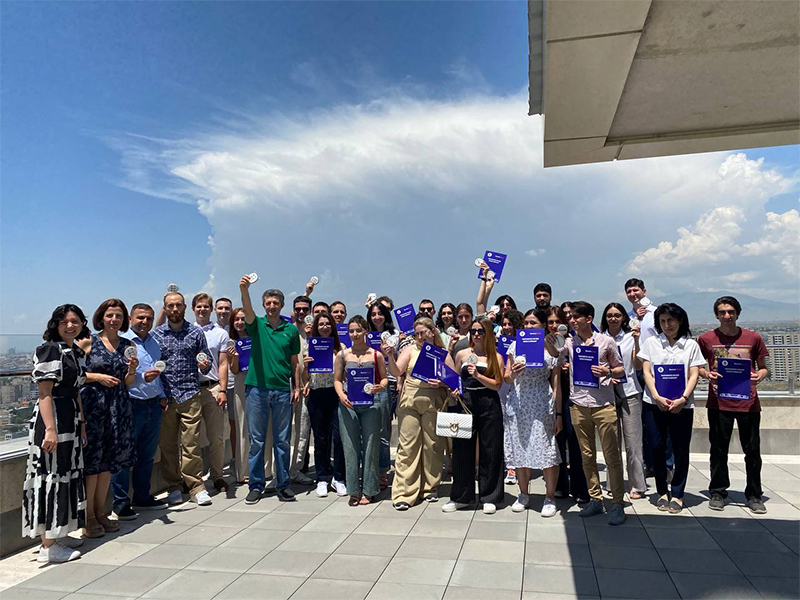
Course 2023–24. 30 people received diplomas.

At the end of each course several of the best students were invited to the company for an internship.

GeoMx and mycosis fungoides

Project on lymphoma

Mycosis fungoides, or cutaneous T-cell lymphoma, is a cancer in which deranged T lymphocytes start proliferating in the skin. The client carried out the wet part of the study using GeoMx technology and ordered the analysis from us at BostonGene. I led the project, worked out the annotations and the nuances of the technology and communicated with the client, while Lesha did the quality control and analysis.

GeoMx technology and files

Original article: Multiplex digital spatial profiling of proteins and RNA in fixed tissue, 2020

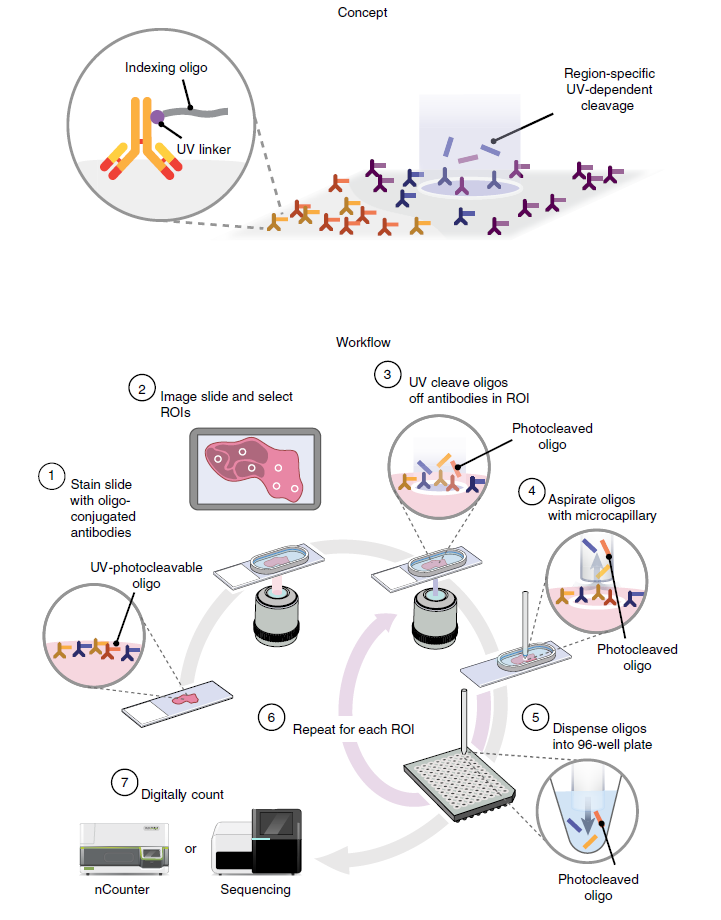
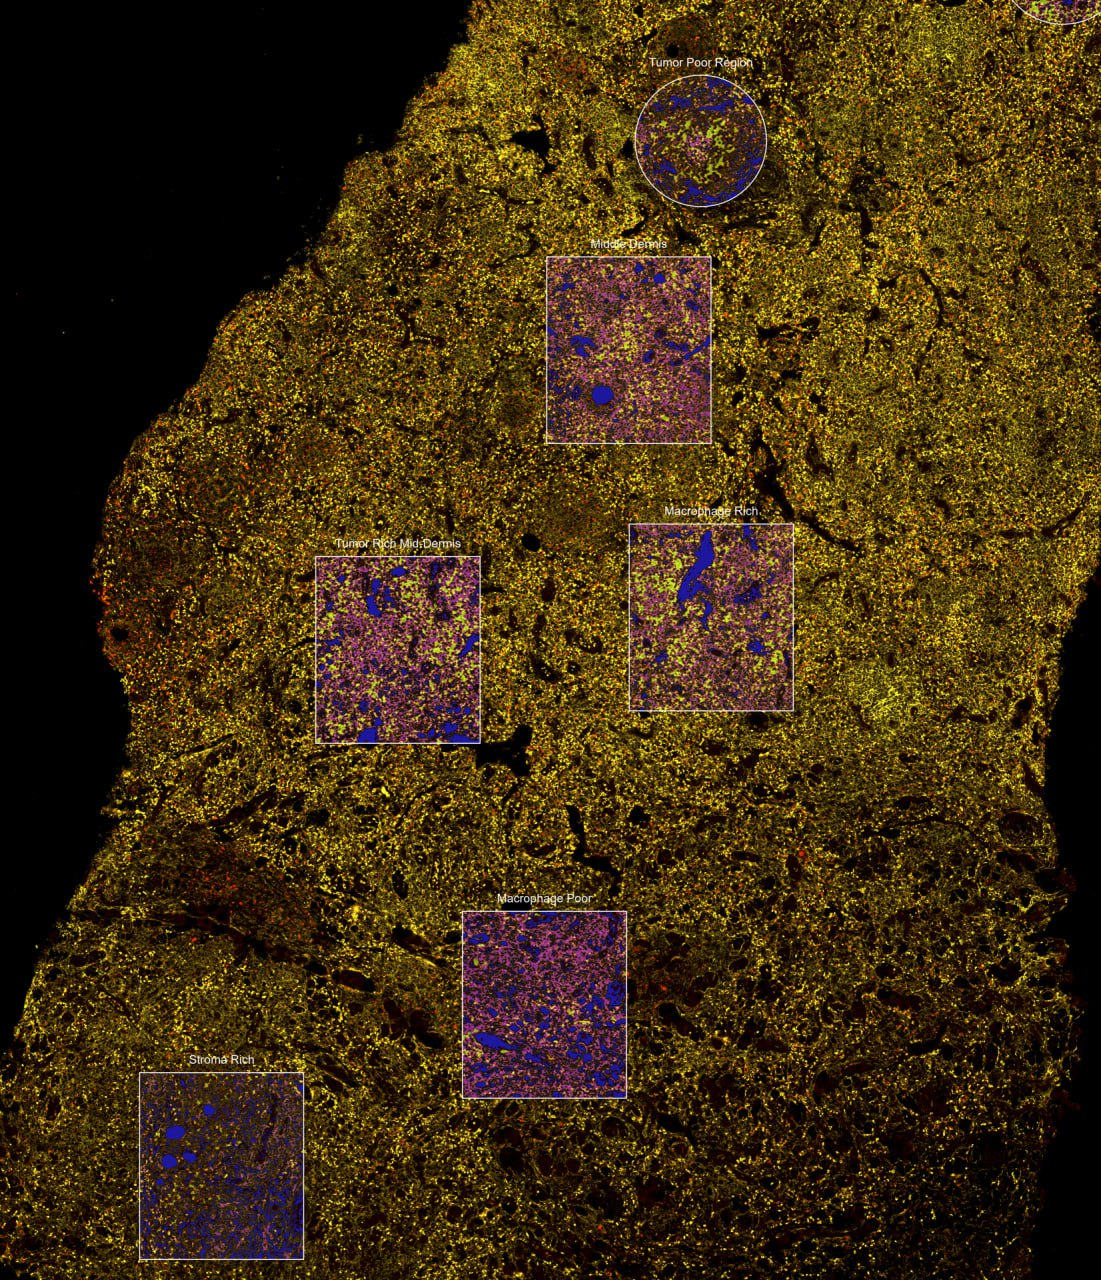
The essence of GeoMx technology and an image of a piece of skin from the study and the ROIs (regions of interest) on this piece.

The essence of GeoMx technology:

  1. There is a pre-prepared set of RNA probes for thousands of genes. These probes are connected by a UV linker to a barcode oligonucleotide. One gene we care about = one barcode.
  2. The biopsy is prepared, placed on a slide, treated with RNA probes, and hybridization takes place.
  3. Then the slide is placed into a machine with a camera, and on the microphoto shown on the machine’s screen, the researcher marks the region of interest.
  4. Then the machine blasts this outlined region with UV light, the UV linker falls apart, and the machine sucks up the barcodes.
  5. The barcodes are sequenced, even on a regular sequencer, and reads are produced.
  6. The reads are matched against a pre-prepared barcode–gene panel. The number of reads from each barcode is basically transformed into the signal intensity of a particular RNA.

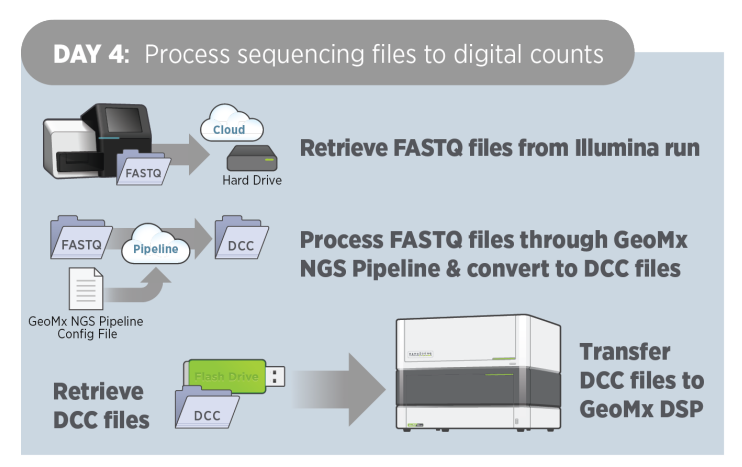
Therefore when we received raw sequencing files it became clear that this was not what we needed. We were sent oligo‑DNA barcodes that by themselves carry no information about genes and need to be matched to pairs of barcode‑gene via a special pipeline. The output files are Digital Count Conversion (DCC).

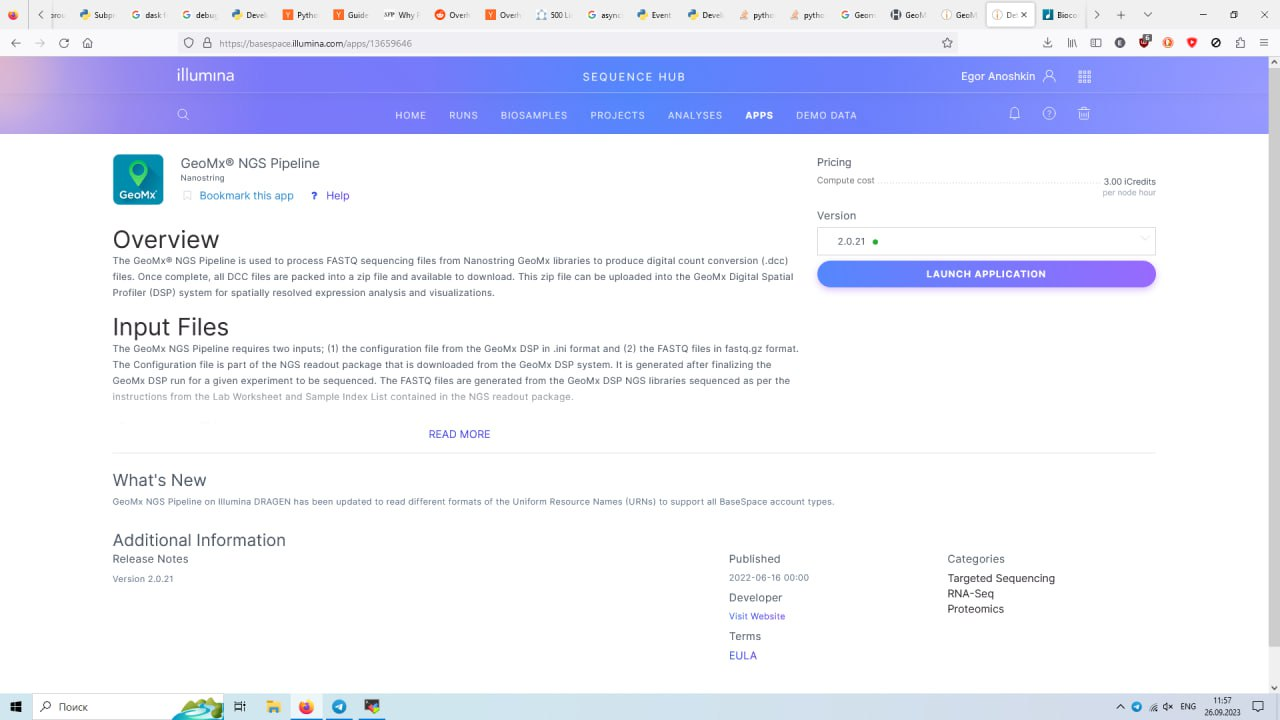
How DCC files are obtained from the GeoMx manual and the Illumina pipeline.

You can process fastq files yourself via Illumina’s BaseSpace GeoMx NGS Pipeline is distributed as a pipeline on BaseSpace. It seems this doesn’t require special access, but it costs money and is not trivial at all. So I decided to write to the collaborator and ask if they already had DCC files. The DCC files were received the next day. Sometimes it’s easiest to simply ask.

Annotation

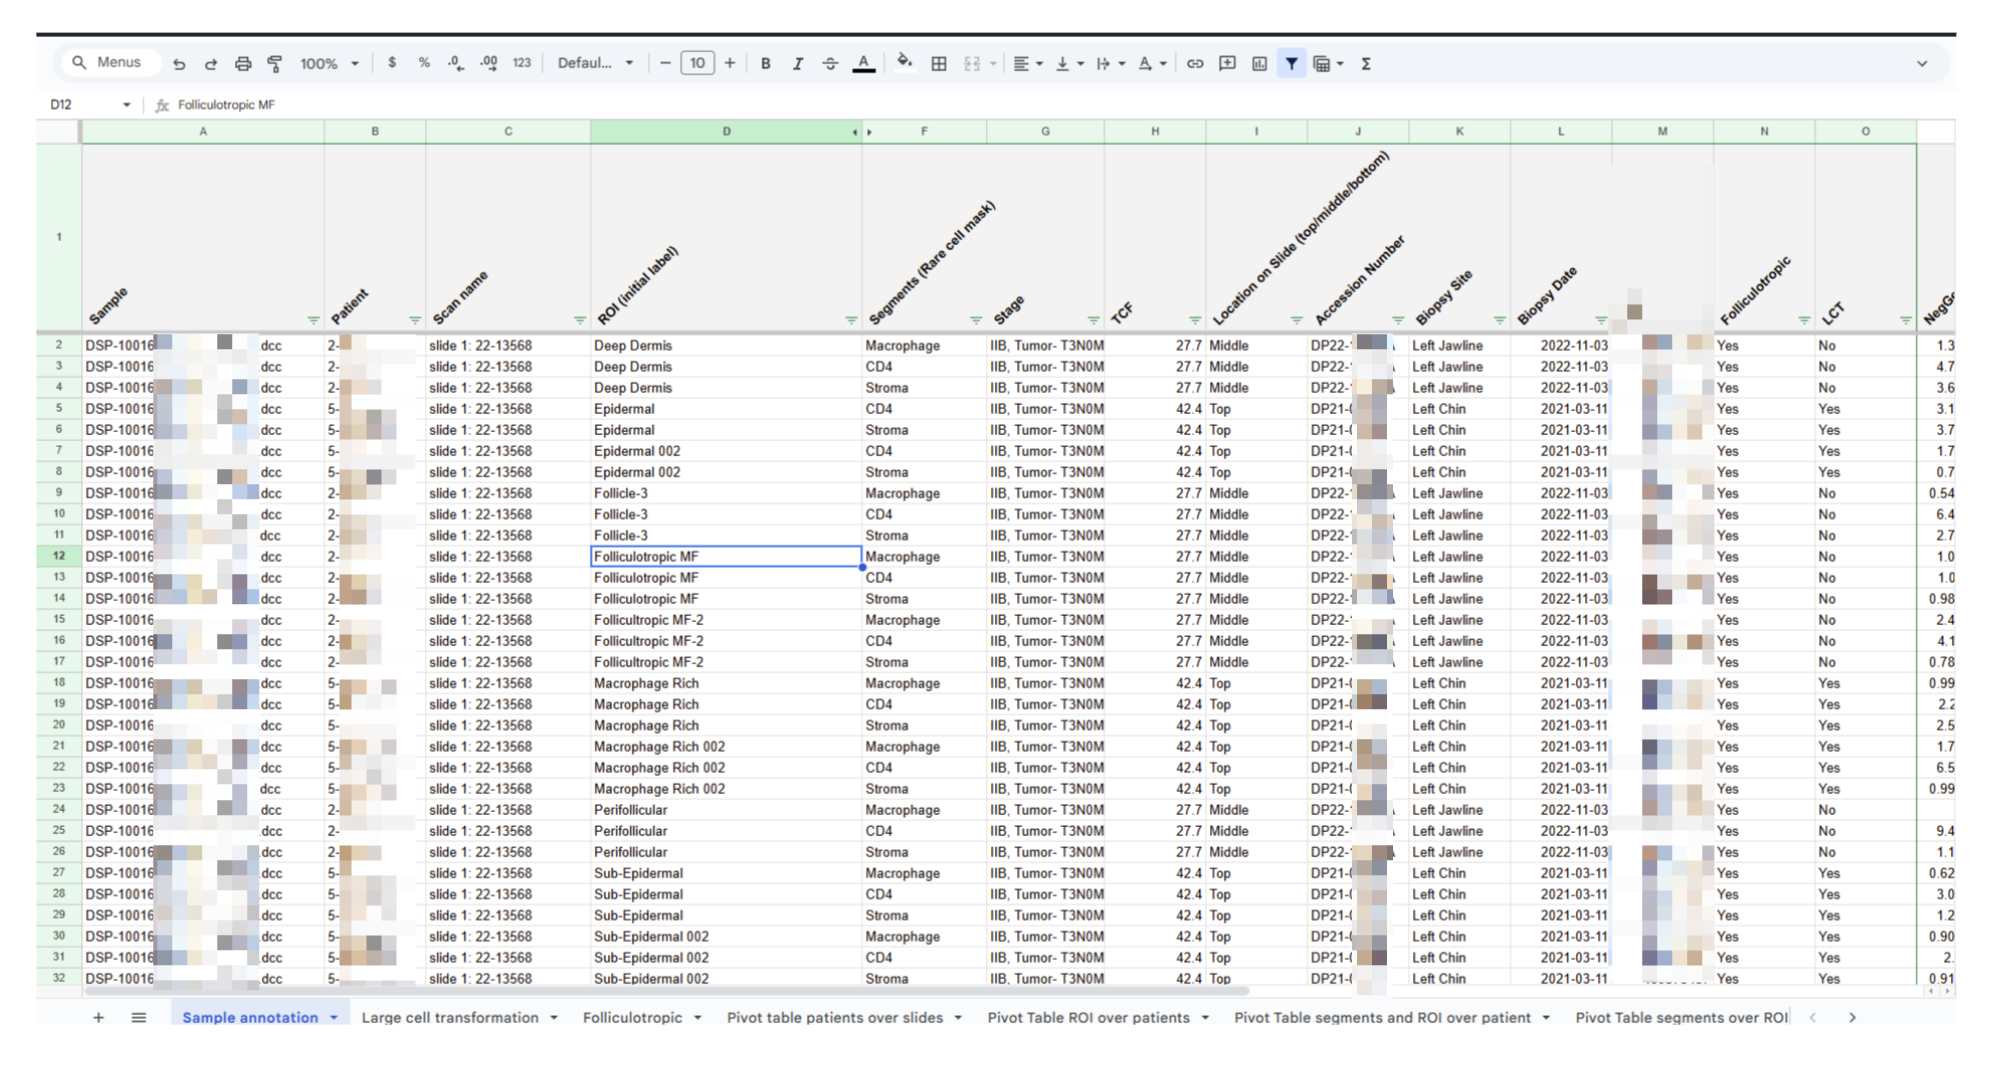
To ask the right questions about the cohort and then answer them you need to understand what you’re dealing with in the first place. In theory each patient may have several slides, and each slide may contain several ROIs. And patients should have different properties, something to compare with something.

The annotation to be grasped

After studying the table it became clear which dimensions are important:

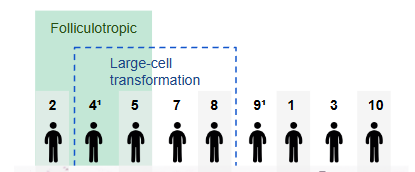
  • Patient — 1st dimension
  • Diagnosis and Large‑cell transformation — 2nd dimension
  • Segments — 3rd dimension
  • ROI – region of interest or mask — 4th dimension

Now this needs to be visualized.
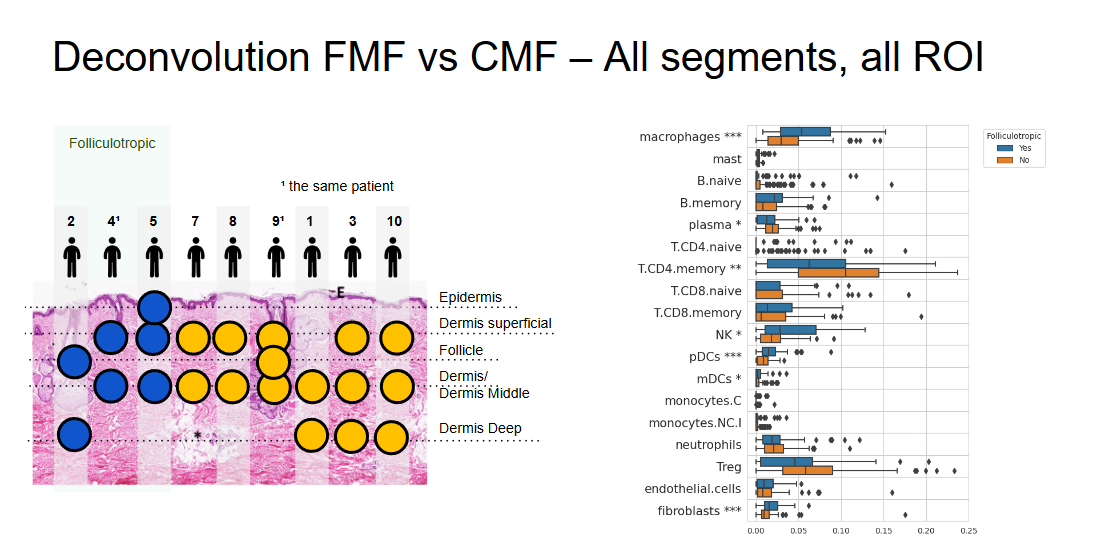
1st dimension. We depicted the patient as a little man —
2nd dimension. We group patients by clinical parameters

It turned out that patients 4 and 9 are the same person. Since biopsies were taken at different times and from different locations, and the cohort is small, I decided to treat these two points as different patients.

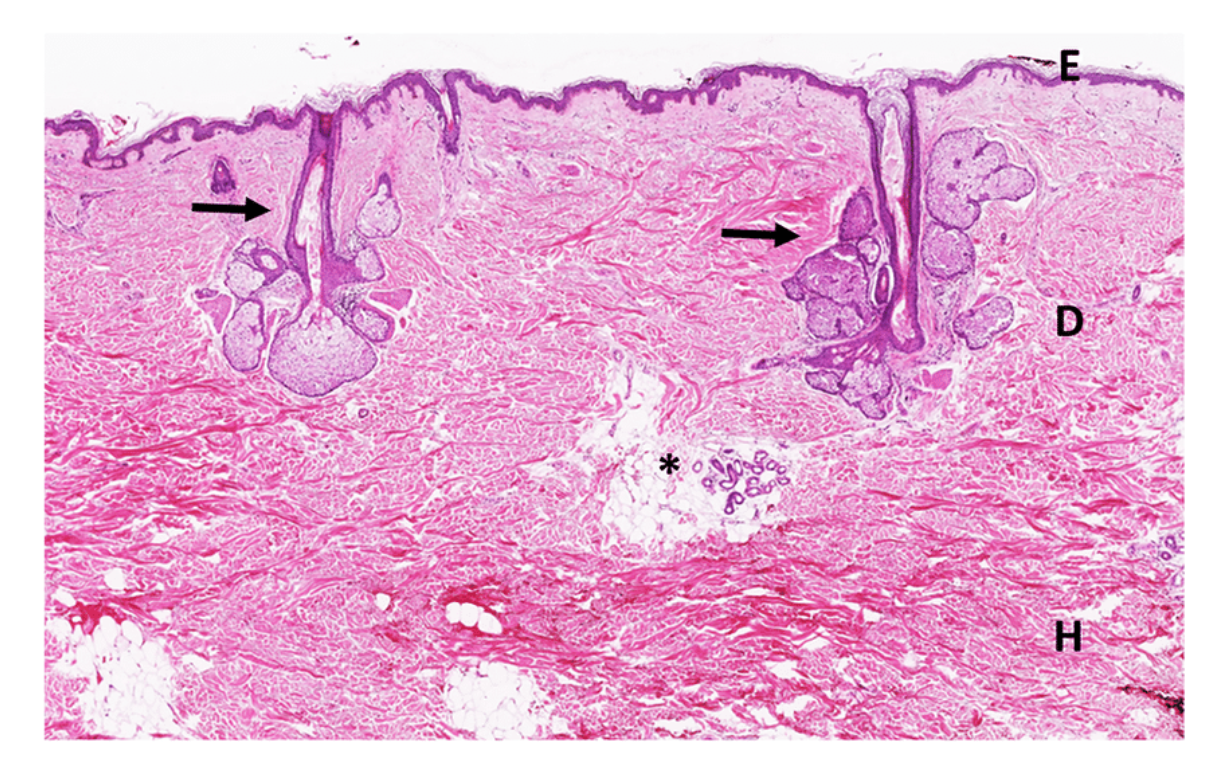
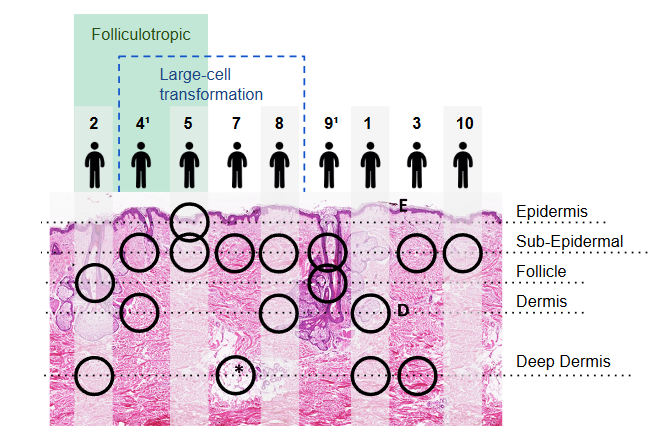
3rd dimension. In the annotation there are names “Epidermal”, “Sub‑epidermal”, “Dermis”. Therefore I decided that investigators took segments according to the principle “look at the skin at different depths”. I chose a picture of “skin in cross‑section” with the upper, middle and deep structures and hair follicles.

We placed the patients above the image of the skin and marked with circles which segments of what depth each patient has. We added the patient number to the skin and labeled it.
The arrangement of the patients is similar to a matrix so that patients 2 and 9, who have a segment from a follicle, are arranged above the follicle in the picture.

Now the data structure is clear. For example, only patient 5 has an Epidermal segment, or follicles appear only in two patients but they have different diagnoses.

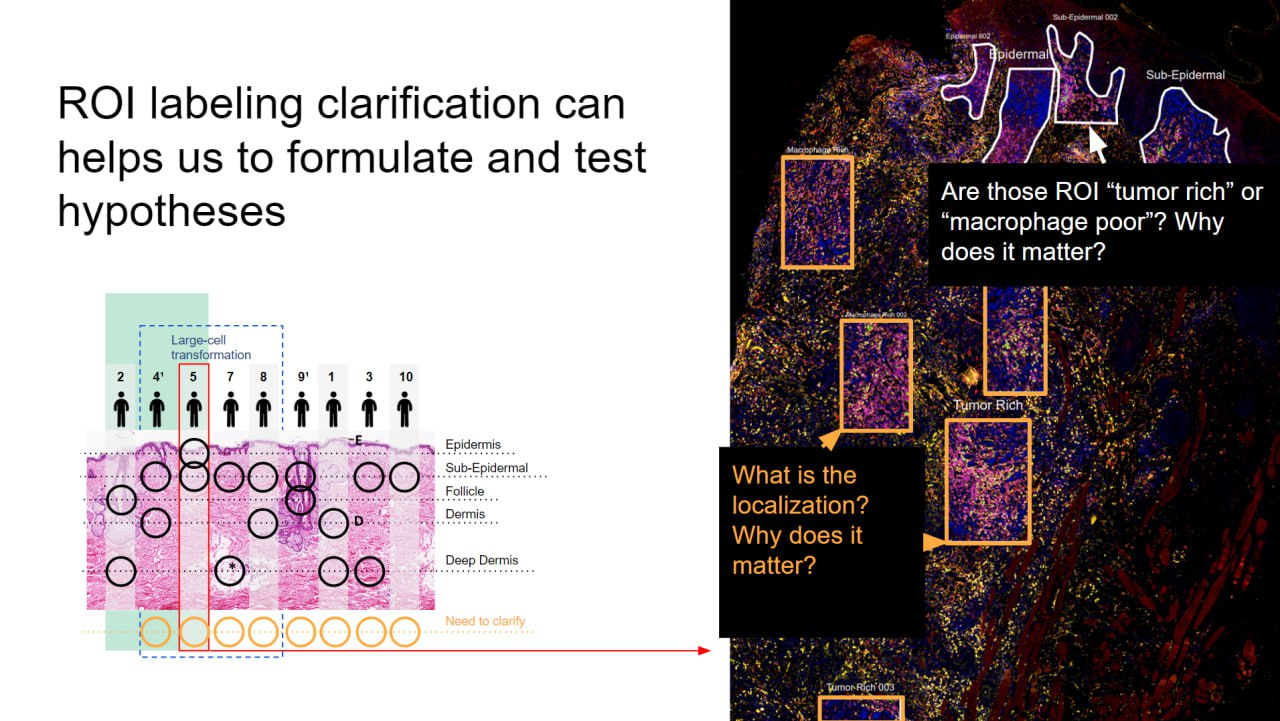
In the course of the exercise it turned out that segment names sometimes designated localization – “Epidermal”, and sometimes a property – “Macrotumor poor”. To clarify the annotation I prepared a table where categories for ROI were partially unified. We asked collaborators to fill in the orange cells and prepared a slide with an explanation of what was unclear.

Nice, isn’t it?

We wrote a letter to the client, explained the situation and asked them to clarify the annotation.

Analysis and results

Lesha immersed himself in the technology, selected tools for work and began the analysis: Background modeling, Quality Control and Normalization for GeoMx RNA data with GeoDiff. Having understood the technology, the necessary files and the structure of the cohort, the rest went without problems.

We found that FMF has an overall inflammatory microenvironment with a predominance of components of innate immunity – T1 and M2 macrophages, NK cells and dendritic cells. And CMF is less inflamed, with a predominance of T‑helper and plasma cells.

Color coding is consistent in the left and right parts of the graphs and allows you to keep track of what was compared. One of hundreds of slides.

The client looked satisfied at the meeting, but then refused to pay us, and we forbade them to publish a paper with our analysis. We never learned the real reason. It happens.

Chronos: NGS database, web service and media

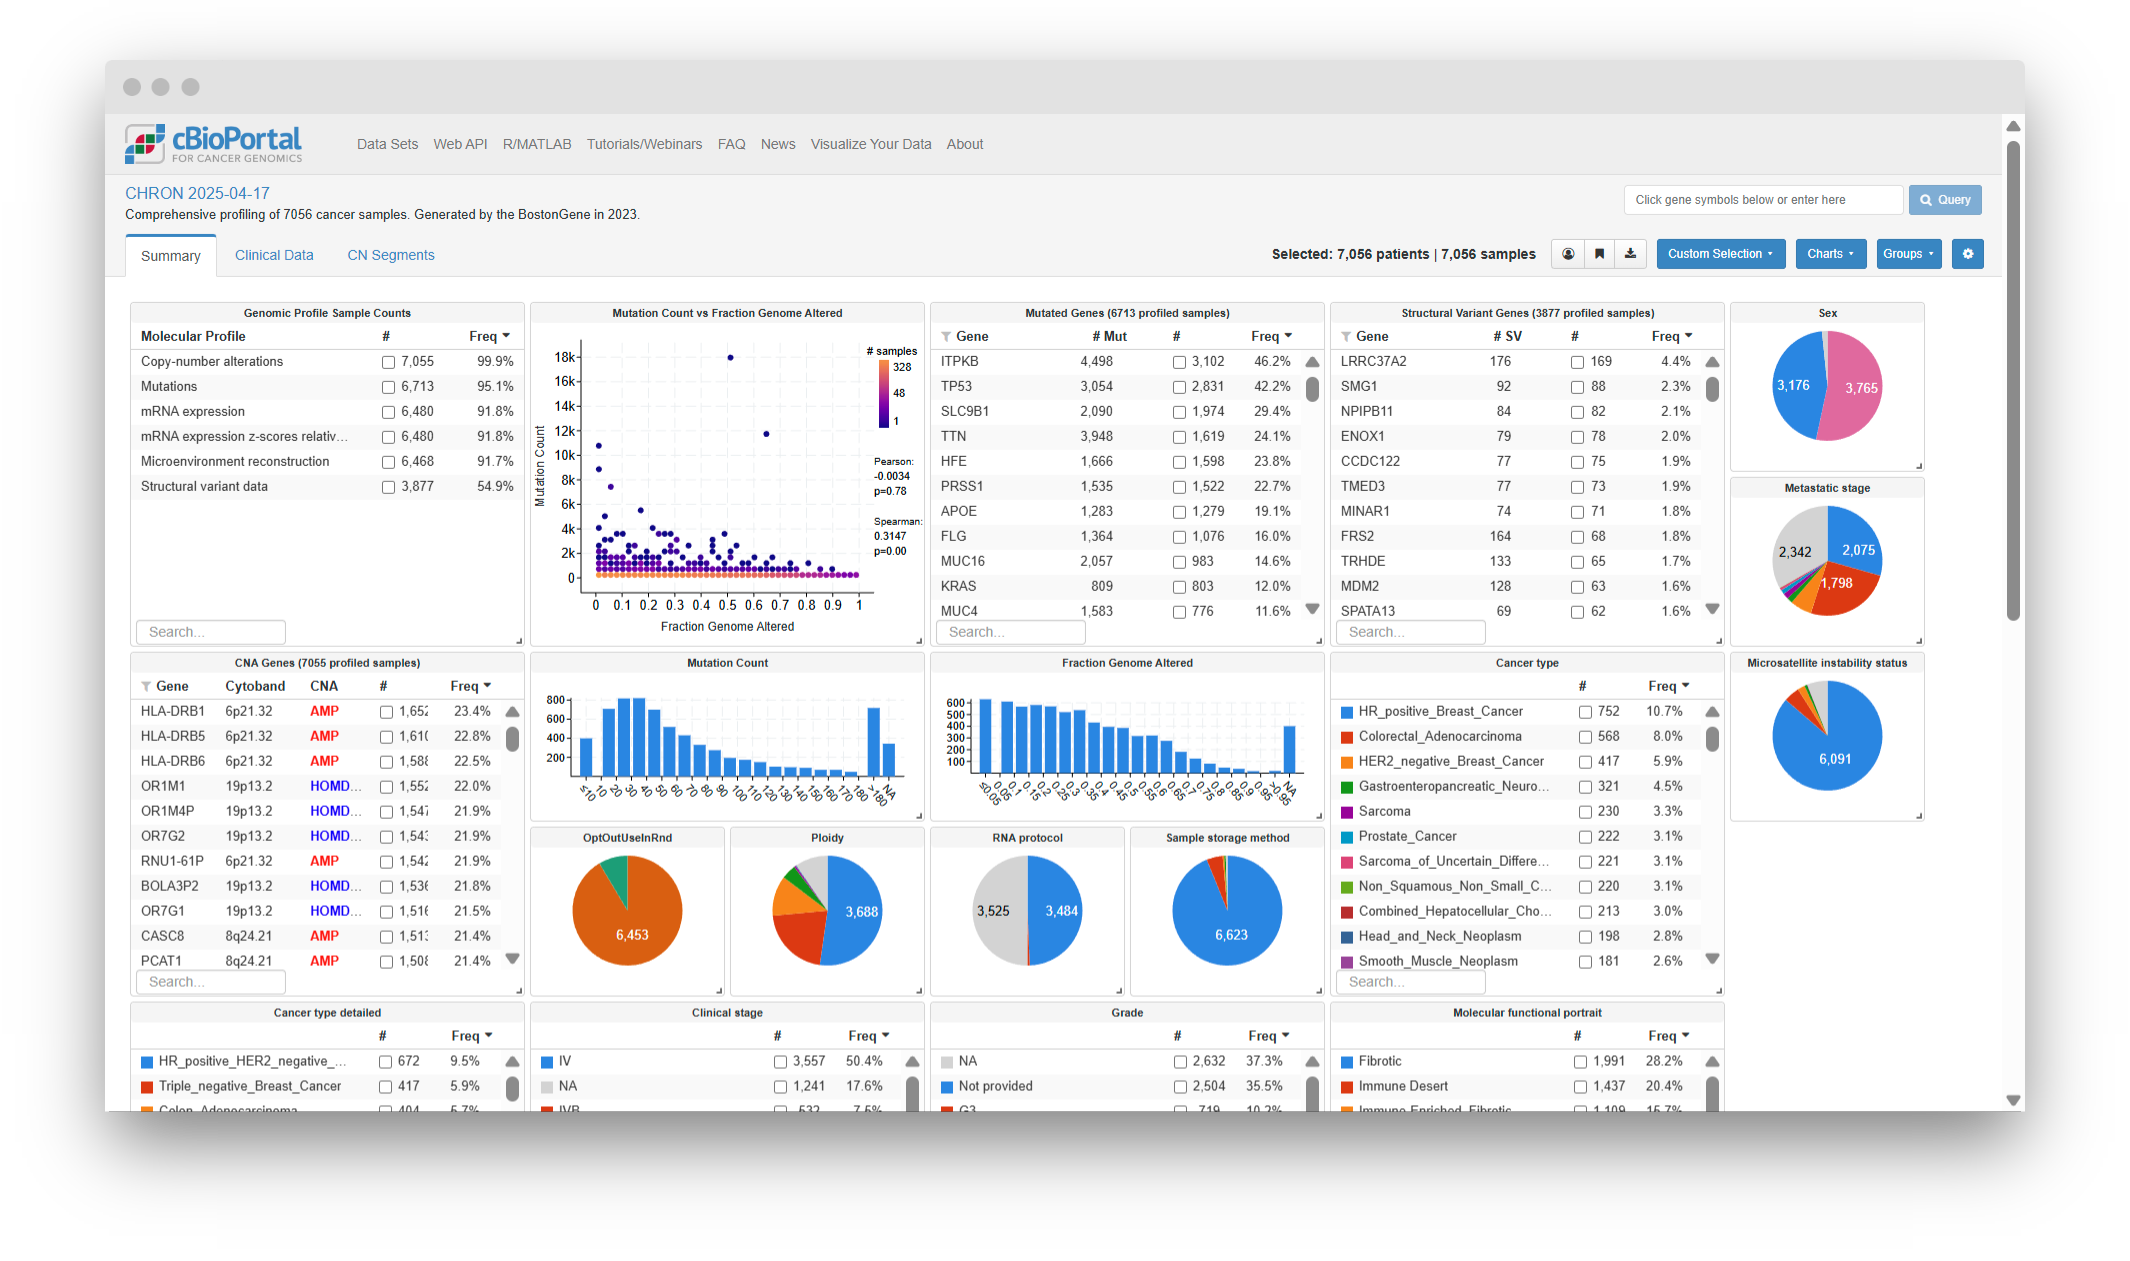
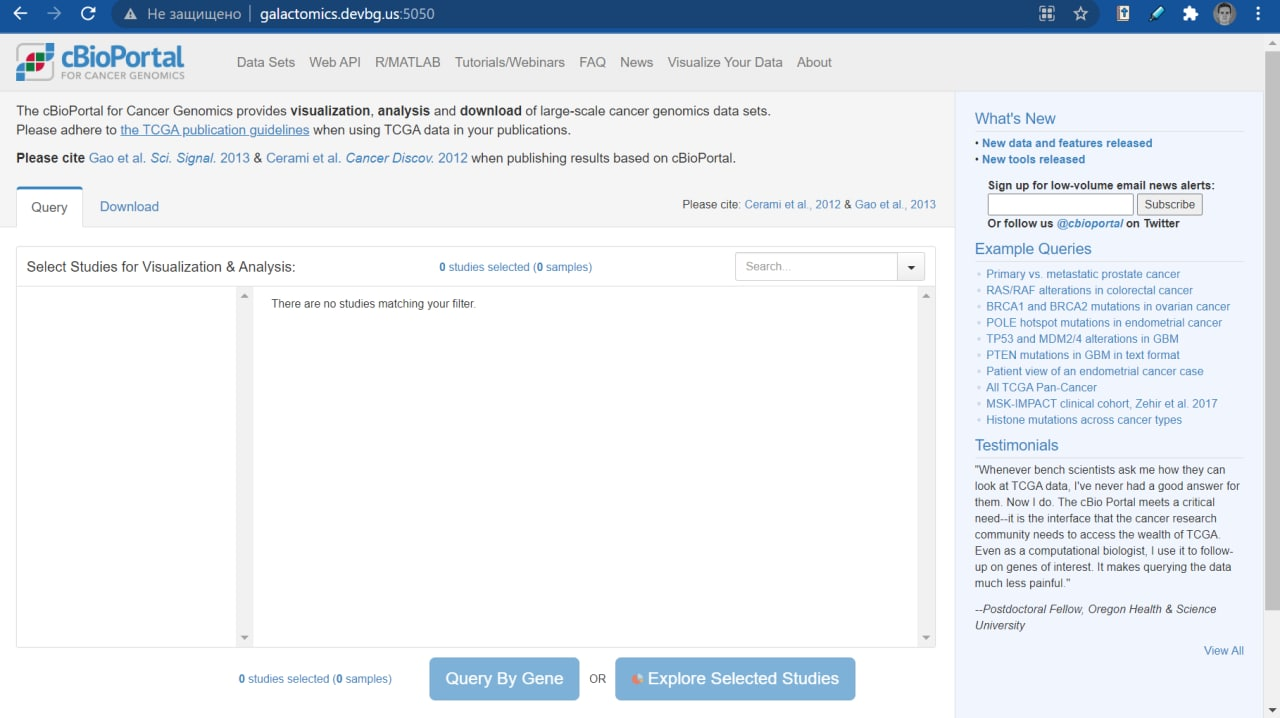
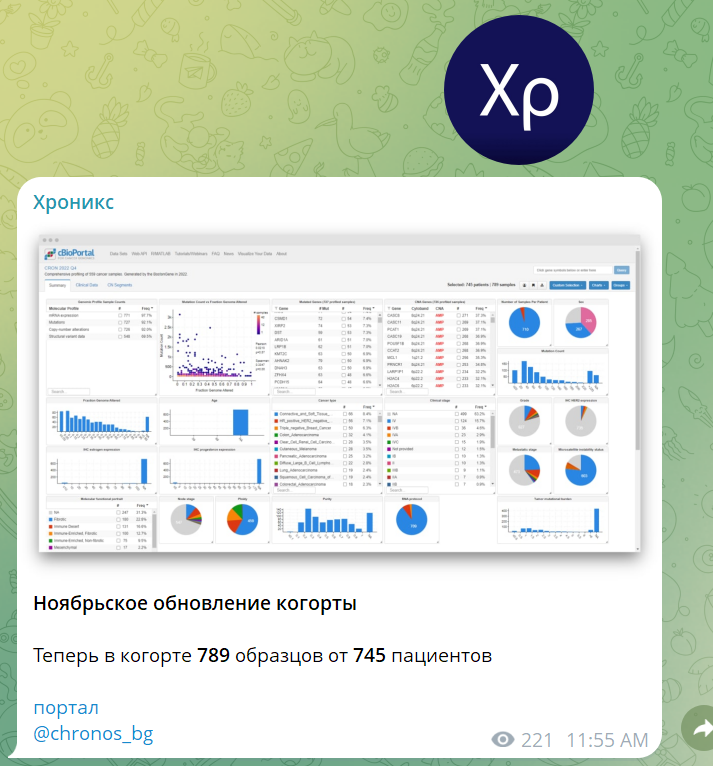
Chronos is a database of NGS data and a web service that makes it possible to work with this database. The database contains anonymized annotations of patients who have undergone the BostonGene clinical test and their NGS data — mutations, copy number alterations, fusions, expression. The cBioPortal web service allows you to analyze this cohort through your browser.

The user works with Chronos through the cBioPortal web service

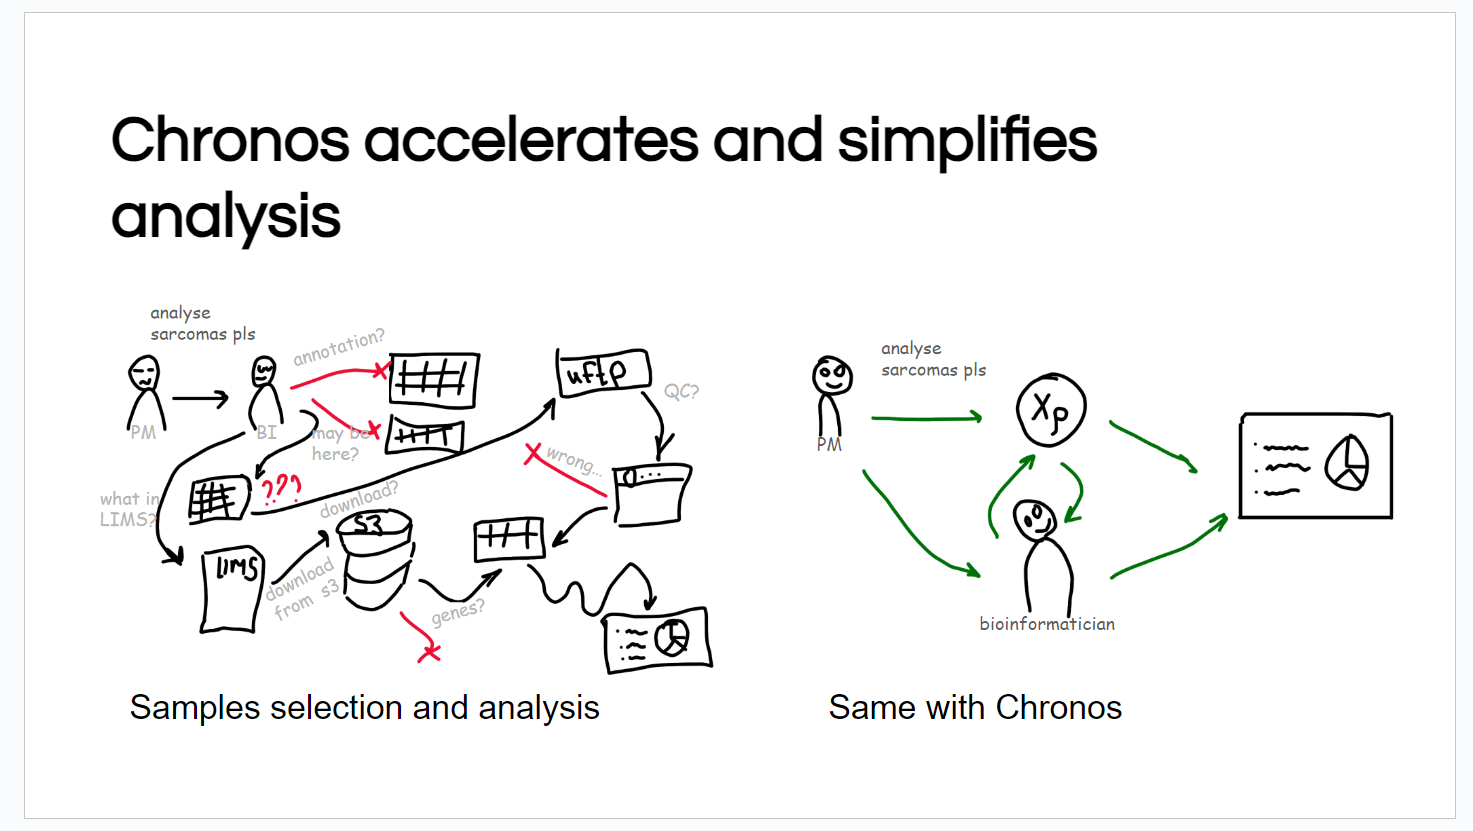
The goal of the project is to accelerate and simplify retrospective analysis of patients: this used to be long and painful, and now there is uniform storage, an analysis tool, and instructions on how to use it.

It used to take a long time just to collect the data before starting the analysis. Now you can focus on the analysis itself.

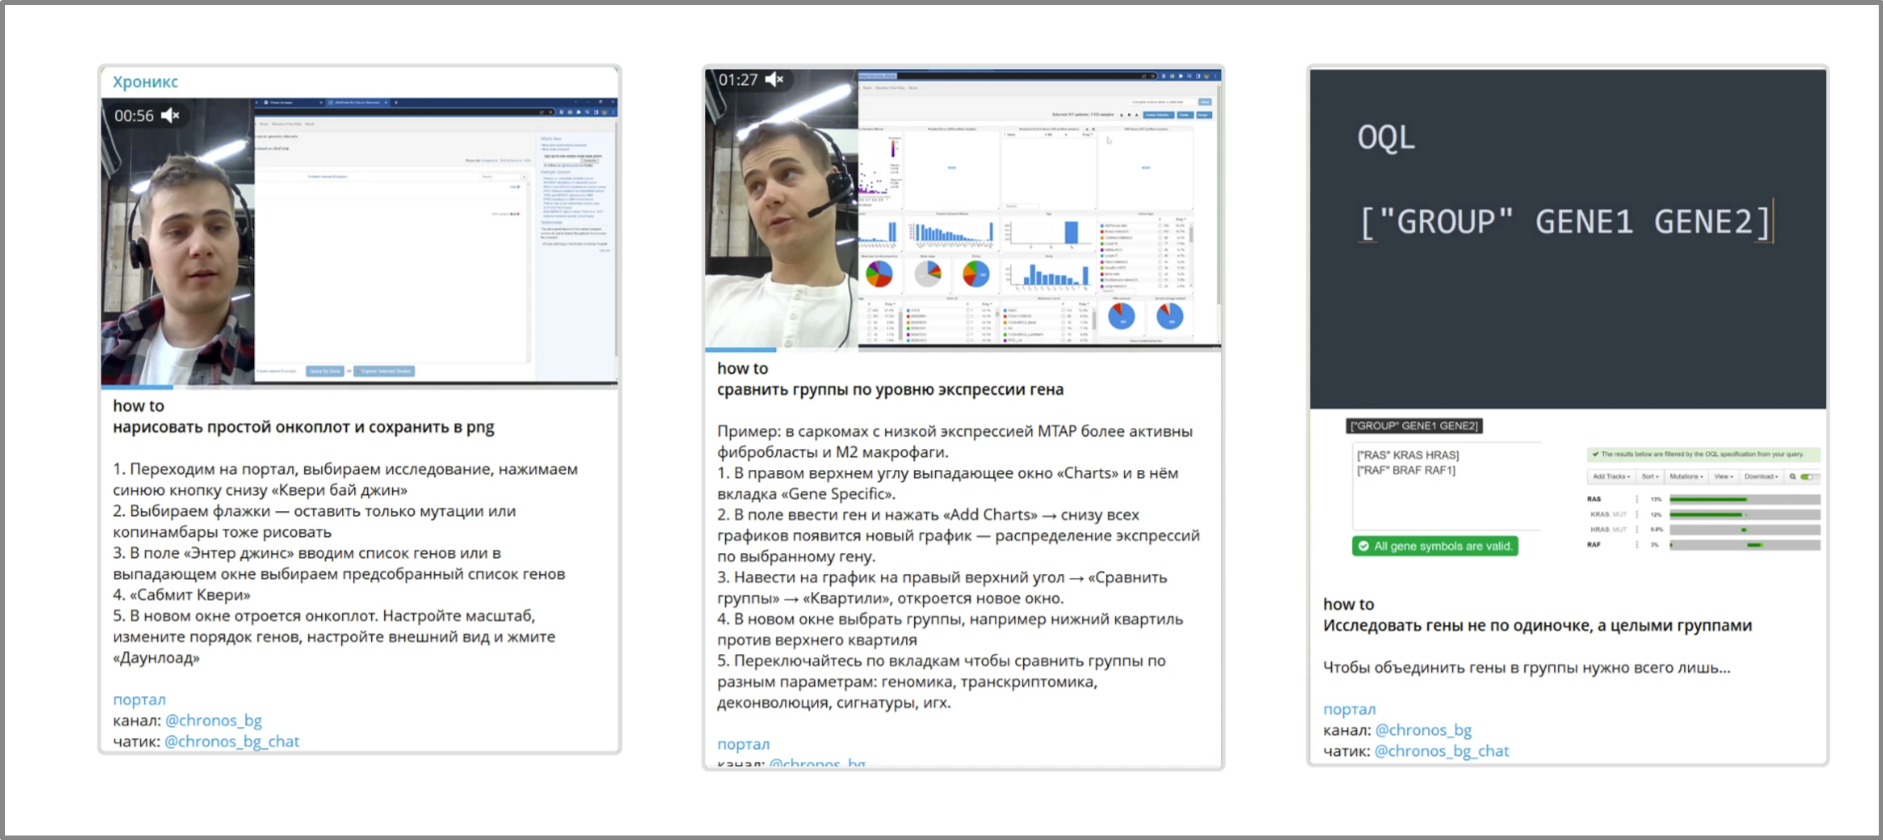
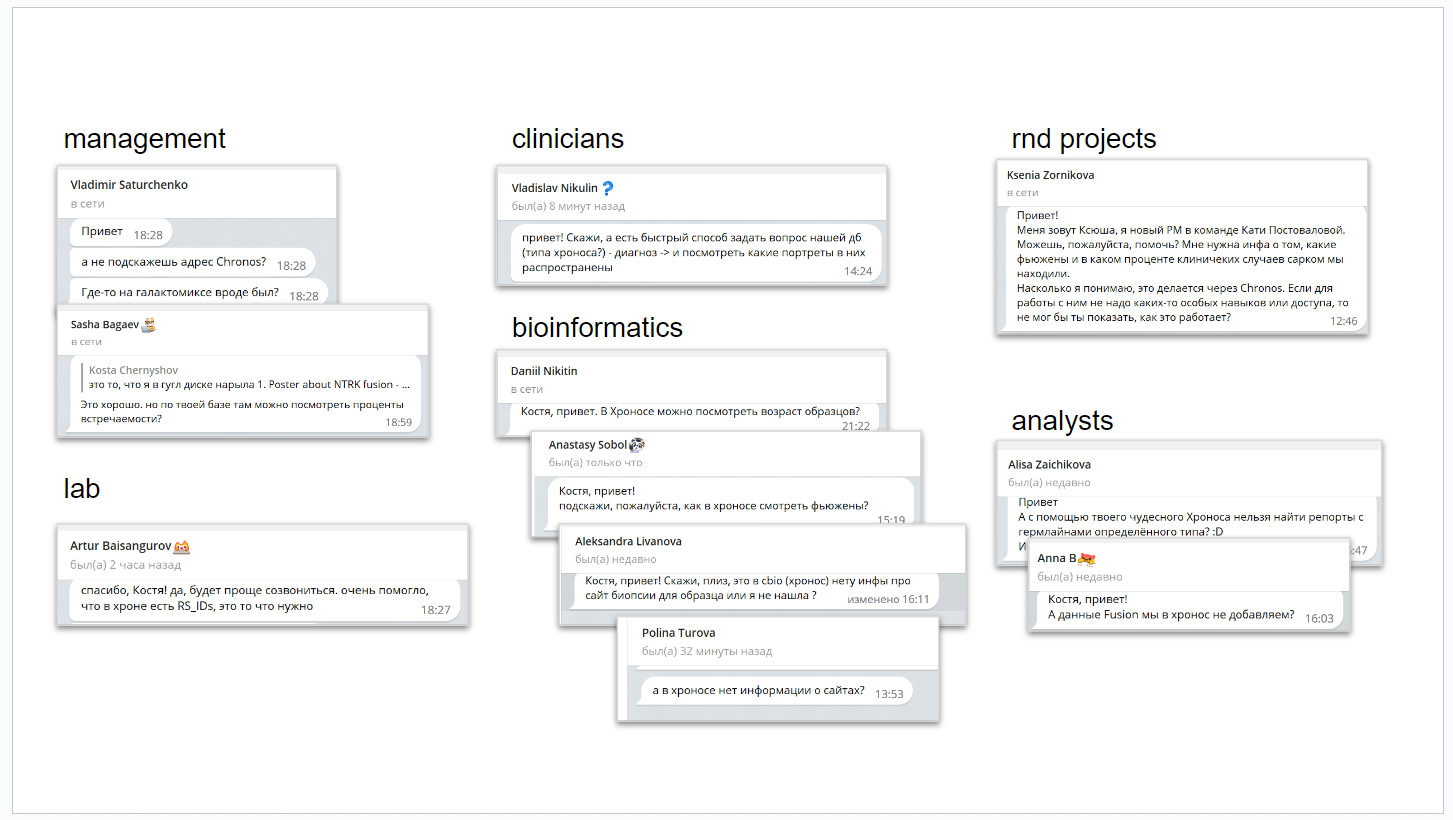
To share news, updates to the database and train users, a Telegram channel was created. For training I recorded short videos and instructions with screenshots. In total about 60 video and text lessons were recorded.

Examples of questions that Chronos helps answer:

  • how many high‑quality and in‑house sequencing samples does BostonGene have
  • how to find a sample by mutation or fusion
  • how to compare double mutants against mutants, for example by microenvironment activity
  • how to compare groups of patients by gene expression level
  • how to draw a simple oncoplot and save the picture
  • how to find co‑expressed genes
  • how to find differentially expressed genes between two groups
  • how to find all samples with NTRK fusions
  • how to find samples with a mutated RAS
  • how to view germline mutation frequencies

🪣 project bin

In the bin I describe the life cycle of Chronos from an idea in 2021 to implementation. You shouldn’t treat Chronos as a pure work project. It’s a samurai’s path.

Start of the project

BostonGene helps patients by performing deep tumor analysis. Information about analyzed samples accumulates and, from time to time, clinical and research tasks related to this cohort arise. For example, a doctor asks: “What is the frequency of HER2 amplifications in breast cancers among the patients I sent you?”

It was necessary to design a system for storing, accessing and analyzing the collected cohort.

cBioPortal, containerization and deployment

cBioPortal is a service for storing and analyzing annotated NGS data developed at Memorial Sloan Kettering Cancer Center. There is their own portal, which they host on their servers and maintain themselves, and there is a packaged version distributed via GitHub for everyone. You just can’t make money on it because of the license.

I studied the documentation for cBioPortal. It turned out that the developers packed the service into docker‑compose. To deploy it on the company’s server for testing, I studied what containerization and the Docker tool are and in the second week I deployed an empty cBioPortal on the company’s server.

Deployed an empty portal on the company’s server

ETL and the first data in cBioPortal

The next step was to study what ETL is and the layout specification and file formats for loading a cohort into cBioPortal.

ETL (Extract, Transform, Load) is a pipeline for collecting raw data from many sources, filtering out unnecessary stuff, transforming it into the desired format and loading it where needed.

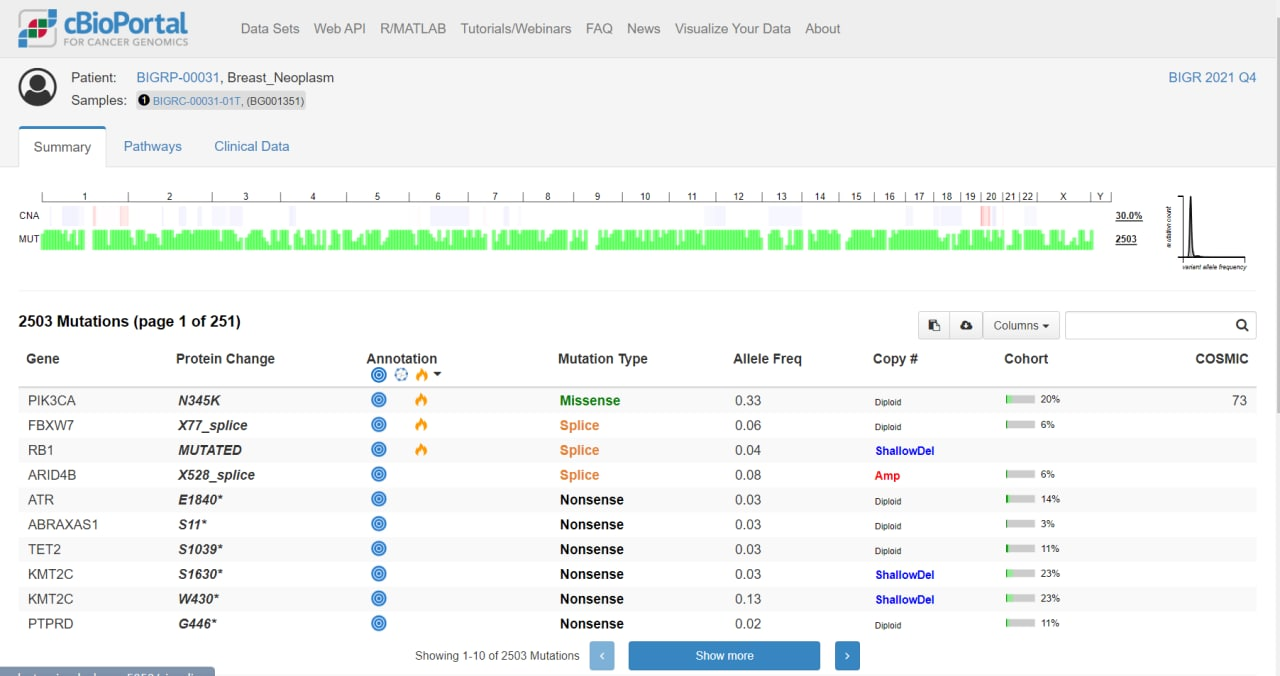
In the third week I uploaded the first annotation, mutations, rearrangements and expression.

Now the portal isn’t empty; annotation, mutations, rearrangements and expression have been added

Relational database, SQL, population and queries to the database

At an early stage we thought that cBioPortal is exactly the tool for cohort analysis with a convenient web interface. And it seemed logical that alongside the analytical tool we needed to create a database from which ETL would then pull data into cBioPortal.

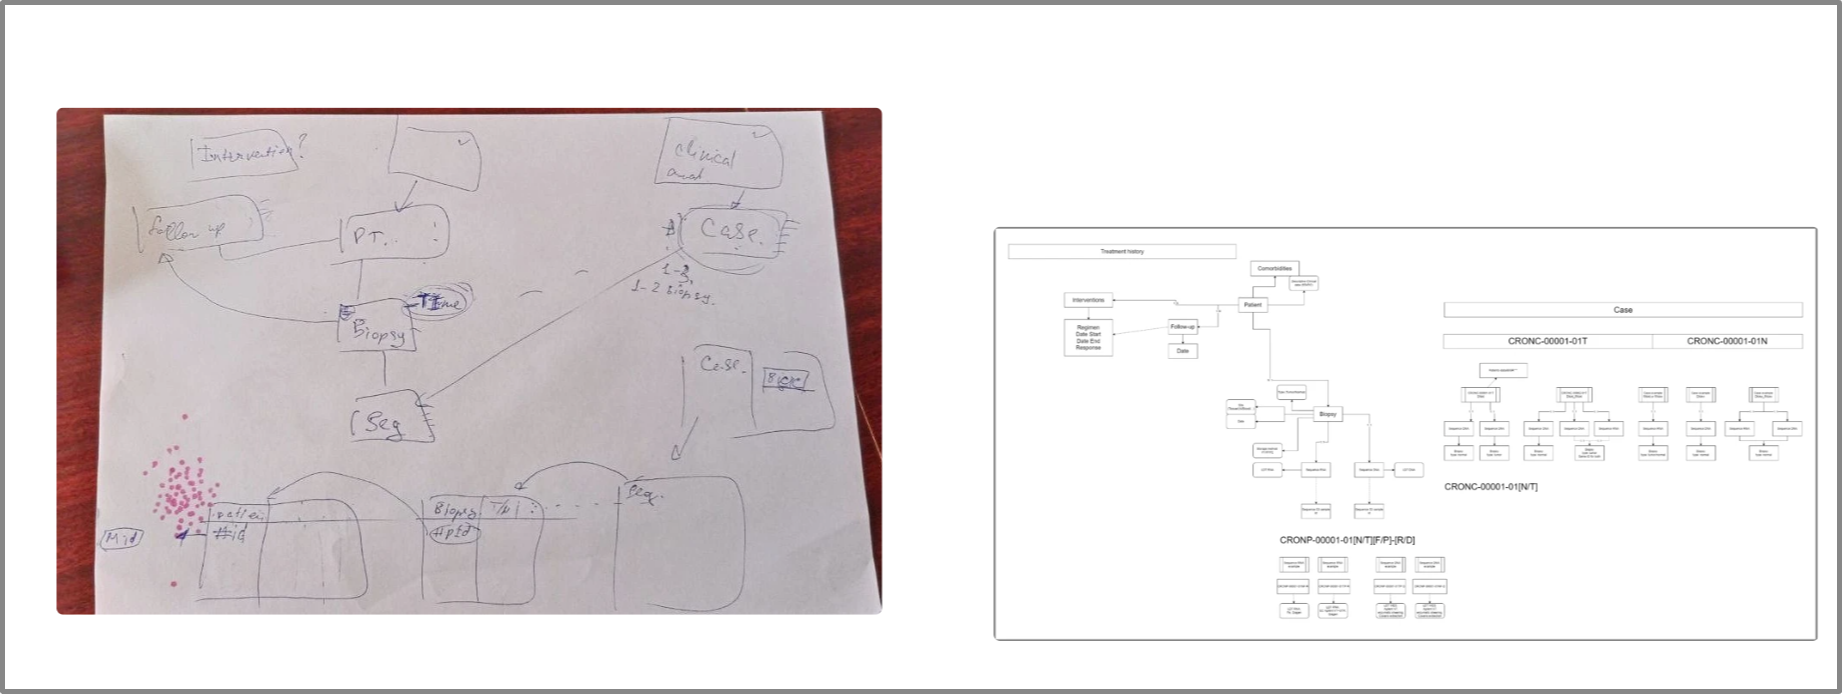
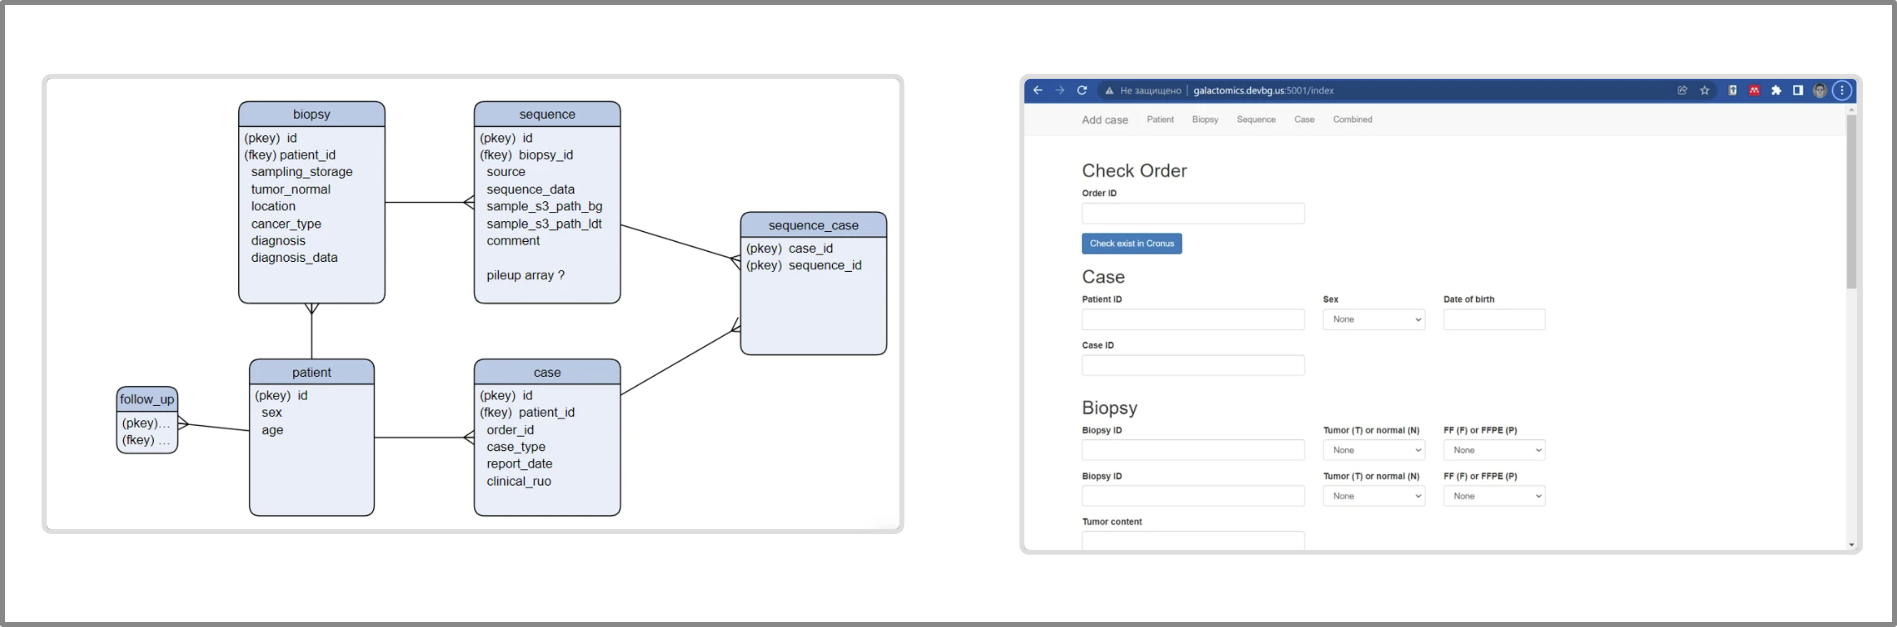
At first I listed what attributes samples and cases have and sketched out a data model that formed the basis of the future database. It turned out, for example, that a patient can have multiple biopsies, and each biopsy can have multiple sequencing runs.

Chronos started with papers and diagrams

While working on the task, I learned what relational databases and PostgreSQL are, the SQL query language and the Python package SQLAlchemy for creating a database schema and interacting with it. I also learned how to populate the database via web forms and the Flask package.

I made a prototype and packed everything into containers using Docker and docker‑compose.

Diagram of the relational database and the web form used to populate the database

Launch of the media and knowledge base

To develop the project further, I needed to understand the real demand in the company for this tool. I created a channel in the messenger and over several months recorded about 60 micro‑instructions and videos on working with cBioPortal, posts about updates and various improvements in the project. As a result, a good internal media for promoting the project and a knowledge base emerged. Demand was confirmed, it’s possible to move on.

Demand confirmed, we can move further.

Delegation of the project

My colleague, bioinformatician Daniil Ivanov, takes over the technical part of the project and I remain the ideologist and promote the project through educational content. Daniil starts a backlog, collects use cases from users, prioritizes tasks, plans the move to Kubernetes, gets rid of the SQL database. He hands the backend and infrastructure to professional developers and dives into operational work with data — ETL, launching pipelines.

A lot of work has been done, but I deliberately do not describe the nuances of technical implementation, because I want to show the life cycle of the project as a whole and not drown in the tech.

Prime

After developers connected the portal began to fully operate, and through the educational channel all this time I tried to warm up the audience. The prime period of Chronos has arrived.

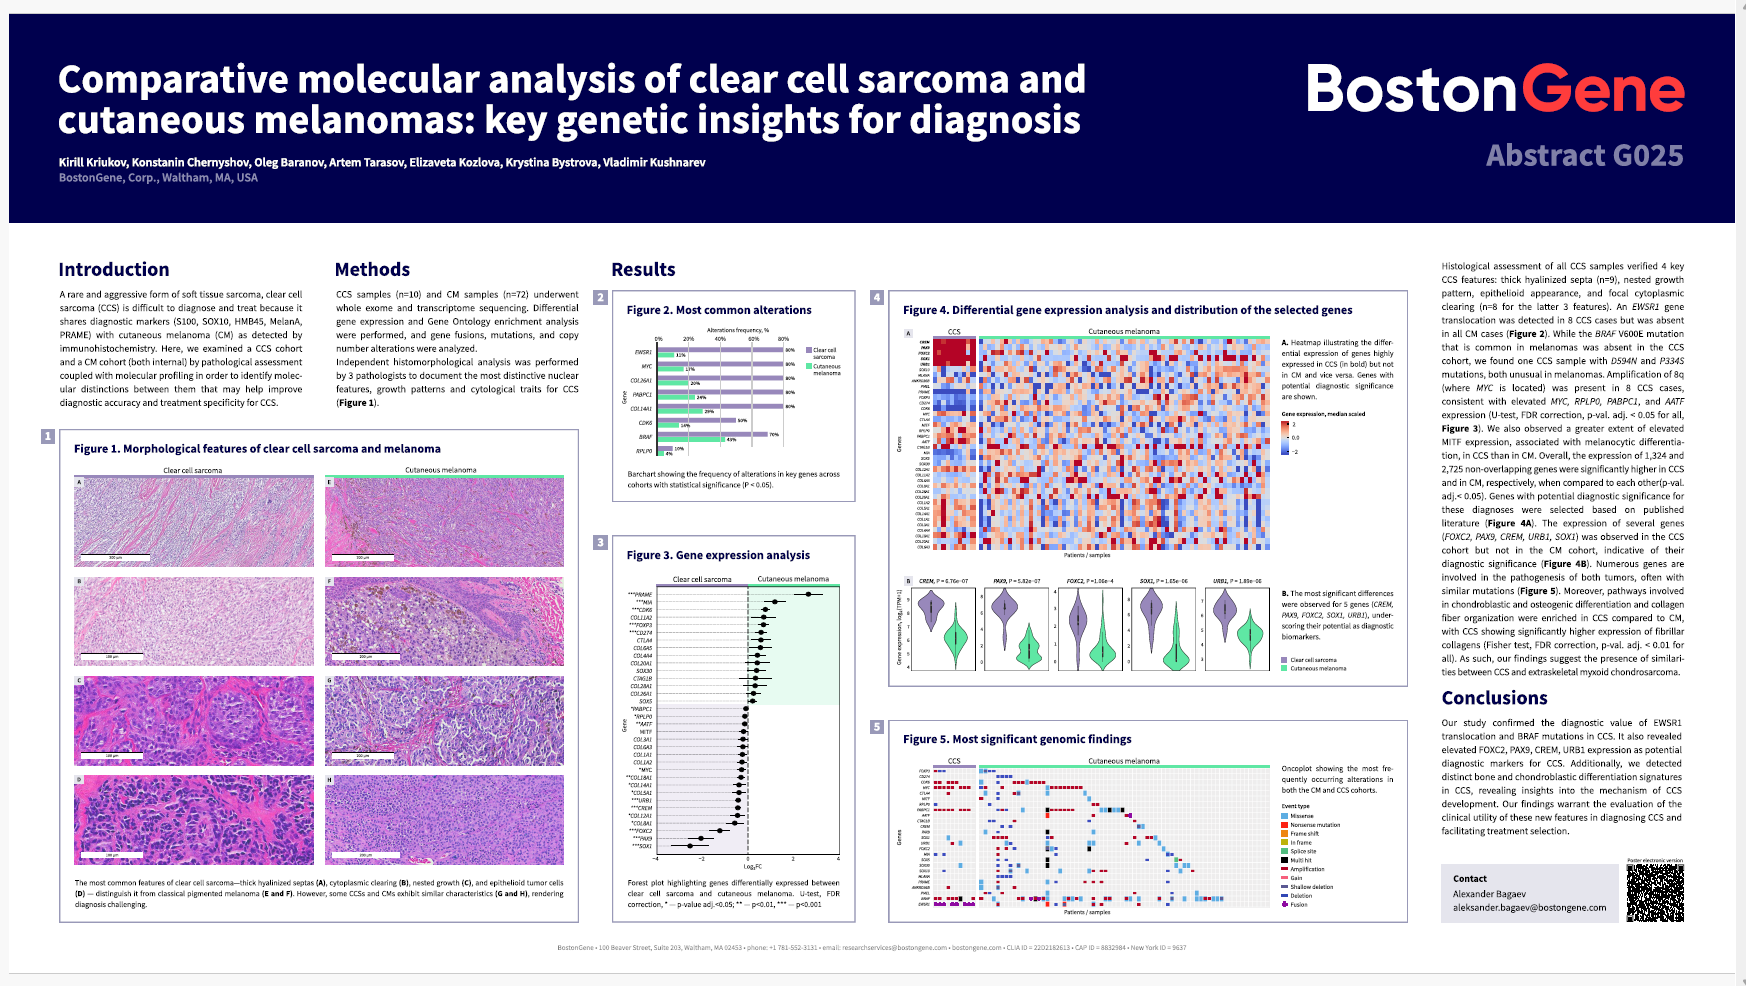
It is used for research tasks and retrospective cohort analysis, helps in hot topics like ADC NECTIN4 and TROP2, abstracts and posters for ASCO and AMP are prepared with it, and the sarcoma cohort has become larger than TCGA. Clinicians look for patients by genetic events, bioinformaticians select samples to validate tools, the director right at the meeting with the client tests hypotheses in cBioPortal.

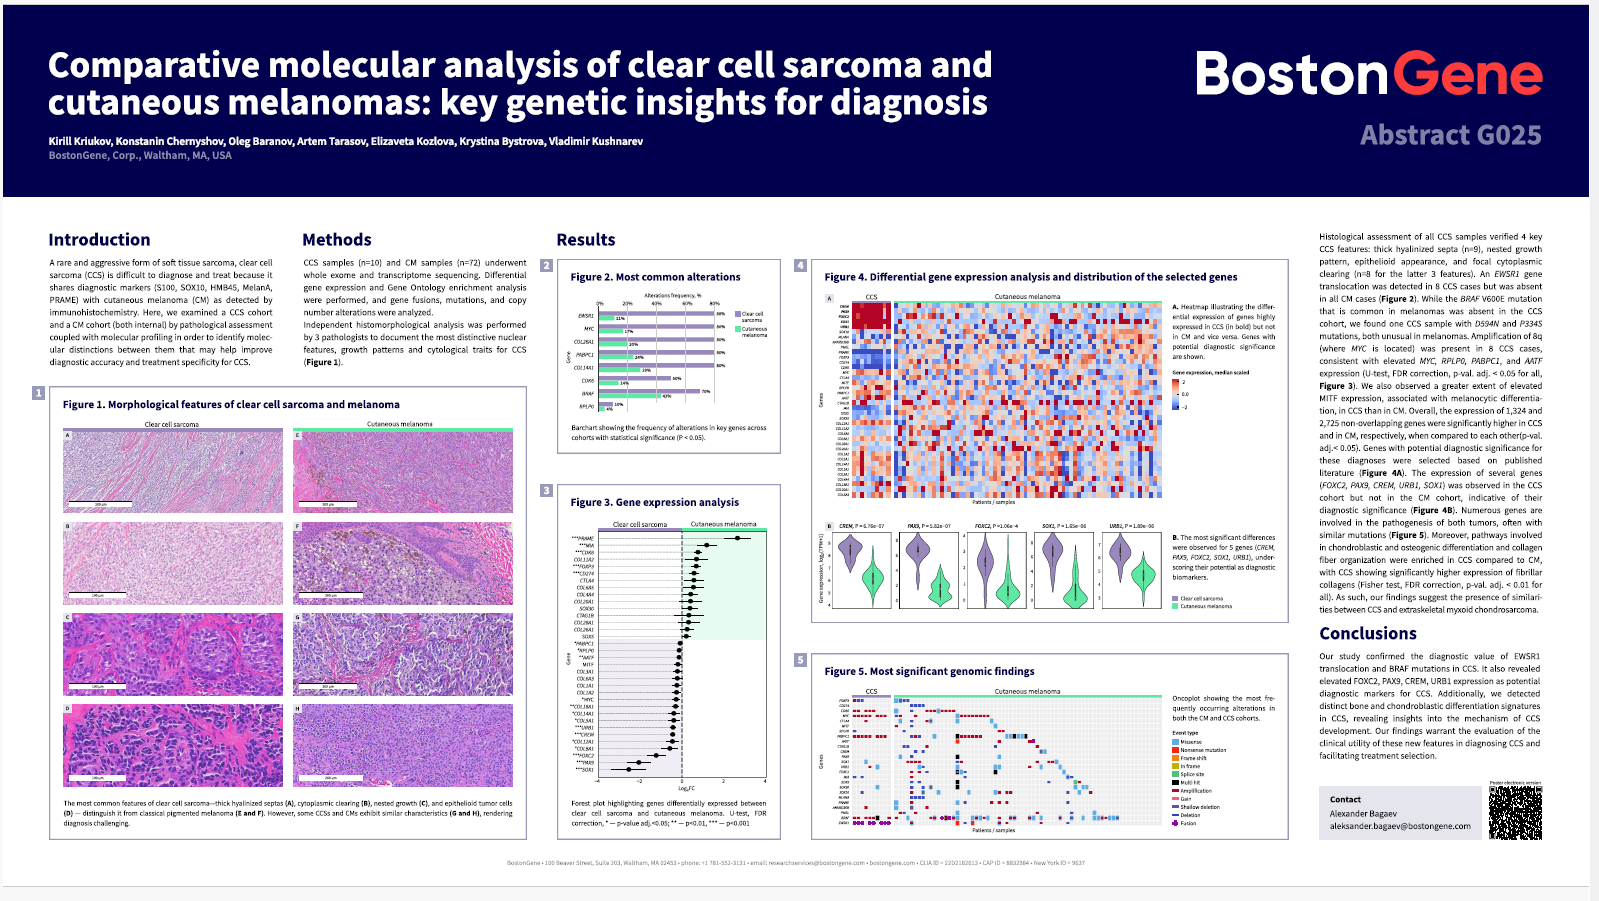
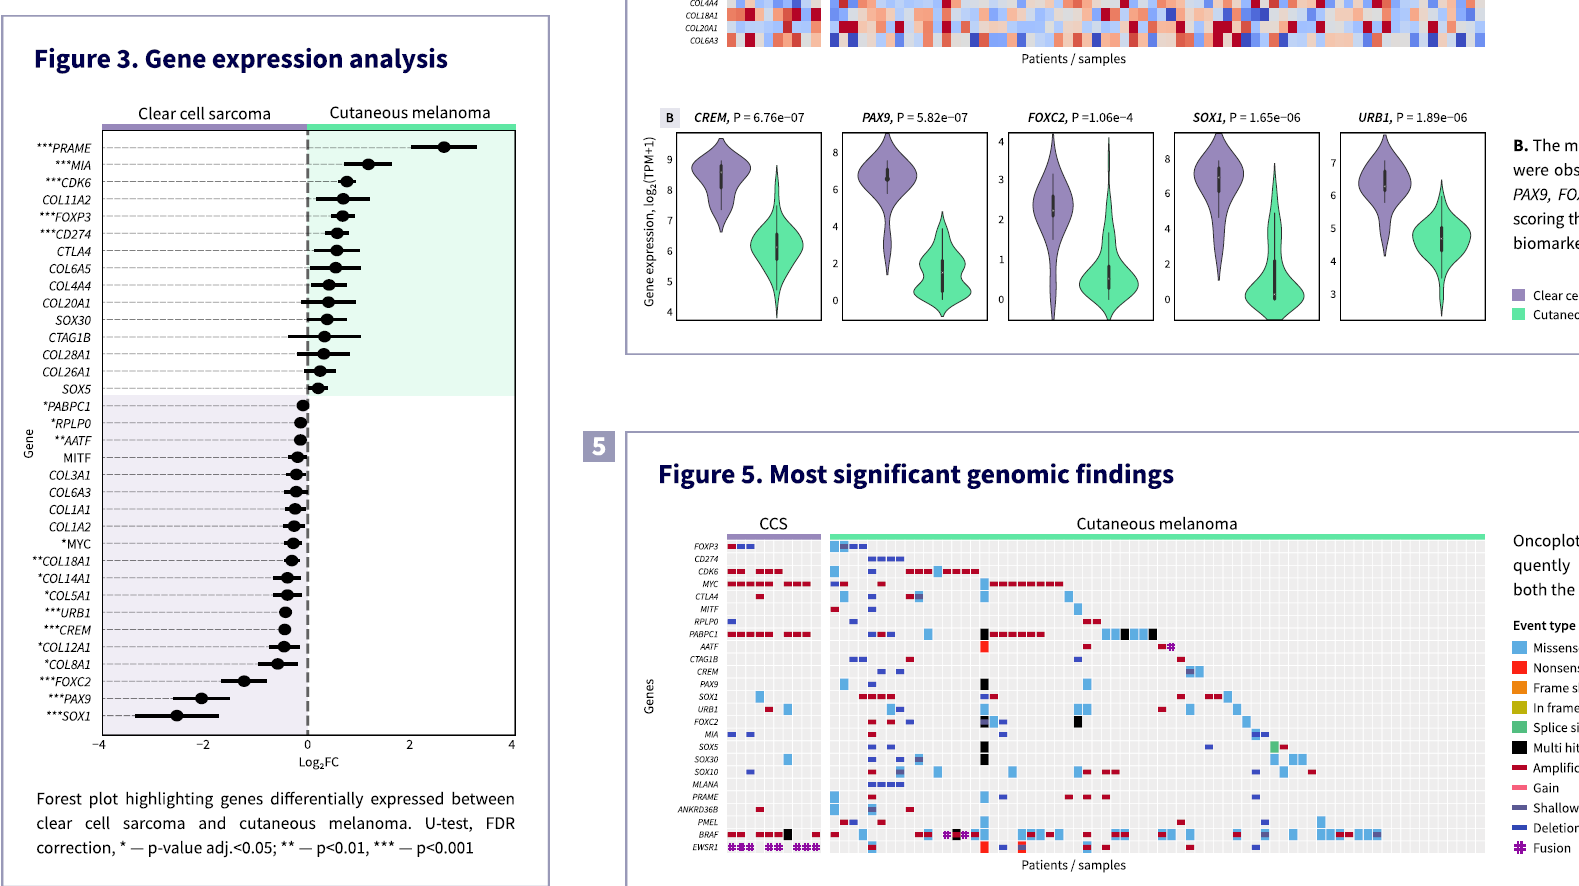
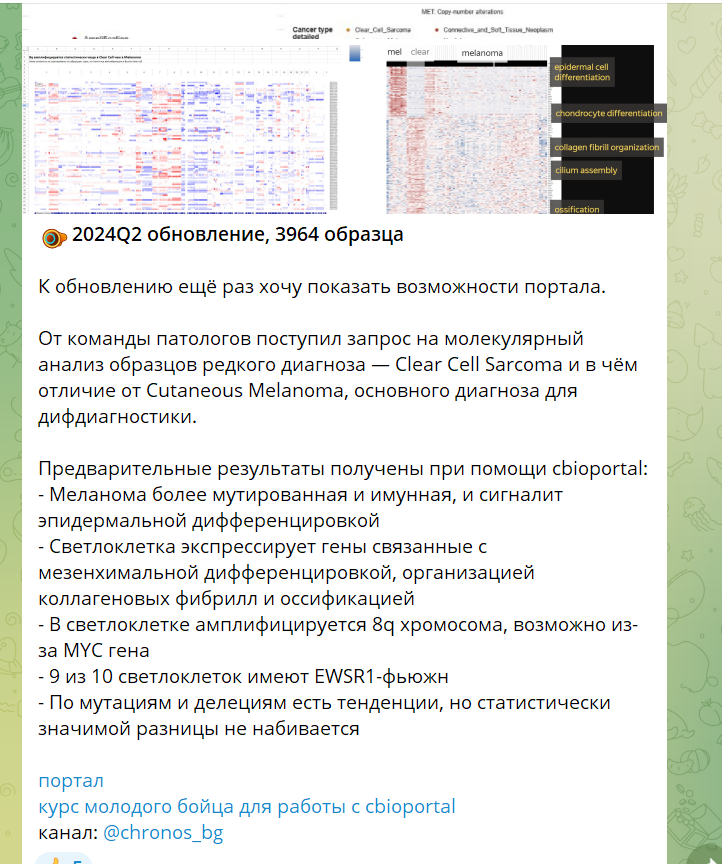
“Comparative Molecular Analysis of Clear Cell Sarcoma and Cutaneous Melanomas: Key Genetic Insights for diagnosis”. Abstract and poster for the AMP2024 conference, the primary analysis was performed using cBioPortal. BostonGene news.

Decline

Then things calmed down. For six months cBioPortal was used only in one research task and one person left feedback that he uses it in his work.

Despite the noble idea, technical implementation, media and knowledge base, the product faced the reality of business and a strong user habit. The business pivoted and orders for retro analysis disappeared. And for research tasks bioinformaticians use JupiterHub, and we could not overcome this habit even after two years of media and cBioPortal workshops.

In 2026 Chronos is experiencing a decline. cBioPortal still works, the cohort is updated every month, but the requests are few. On the other hand the project is already so autonomous that it needs improvements and constant supervision less. So that’s fine.

Microenvironment of Urothelial Cancer

Context
Bladder cancer is quite common and for some reason it responds poorly to immuno-oncology drugs, although in many cancers such therapy is already the standard. Perhaps we don’t yet know something about the immune microenvironment of this cancer.
Goal
To study the tumor microenvironment of bladder cancer.
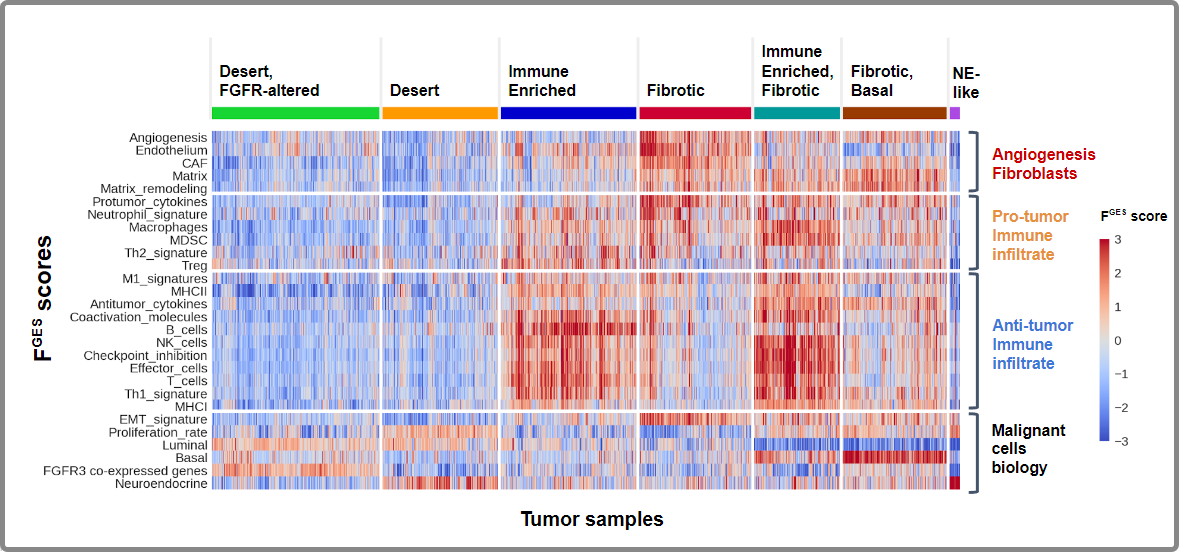
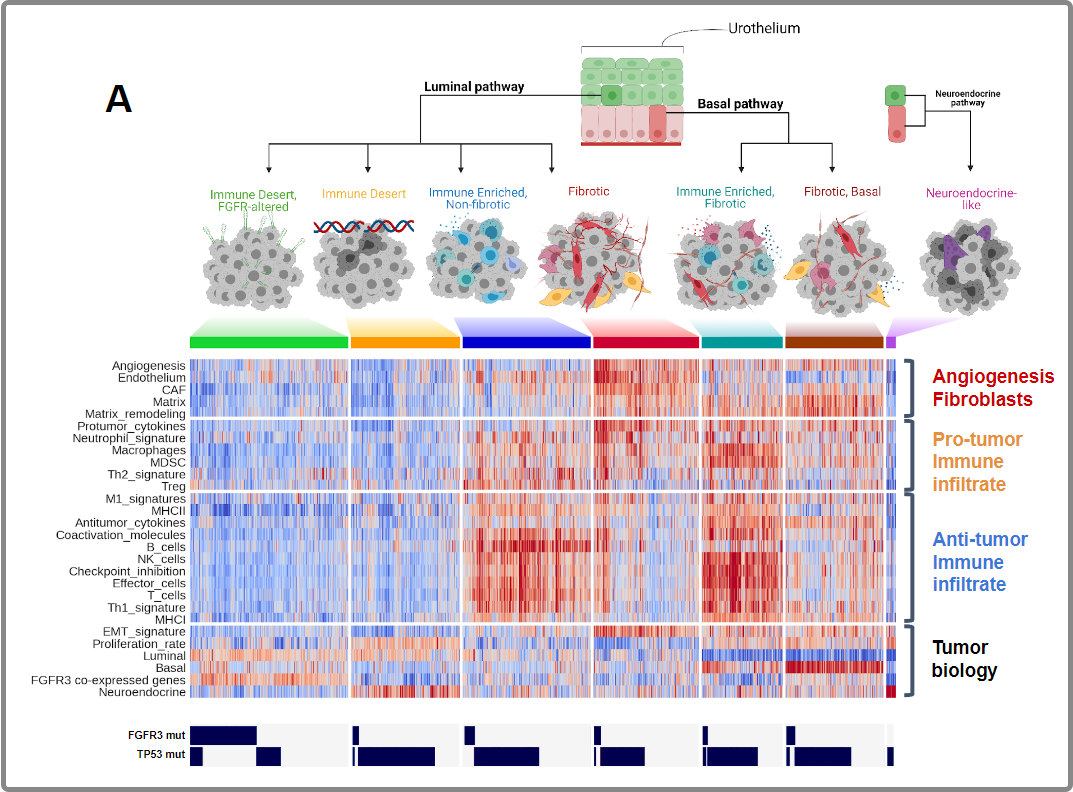
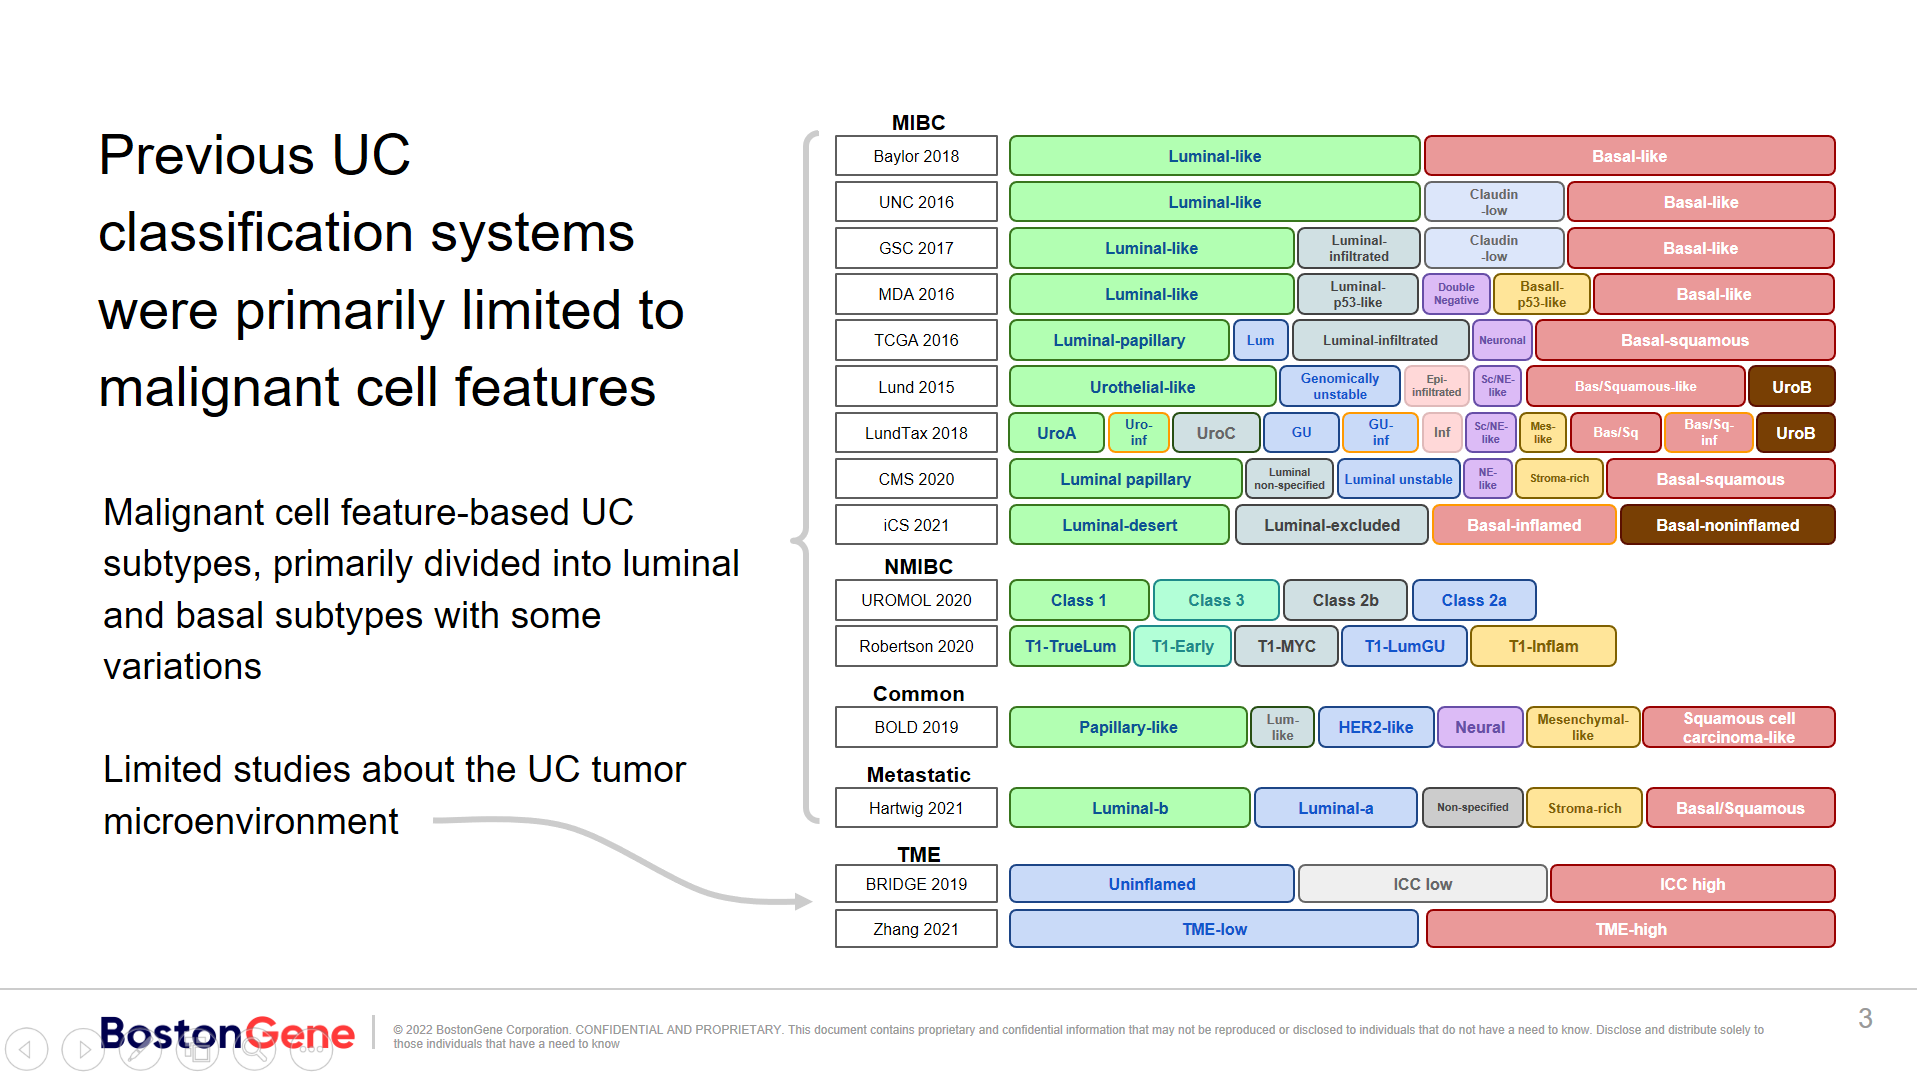
From the literature I learn that researchers are obsessed with the properties of malignant cells and have generated as many as 13 classifications. They all say there are Luminal and Basal subtypes, something in between, and sometimes they single out a special Neuroendocrine subtype. Meanwhile, the microenvironment has been studied in only two papers.

I combined all of the classifications. Subtypes with similar biological properties I highlighted by placement and color.

On the other hand, there is a good way to study the microenvironment developed at BostonGene.

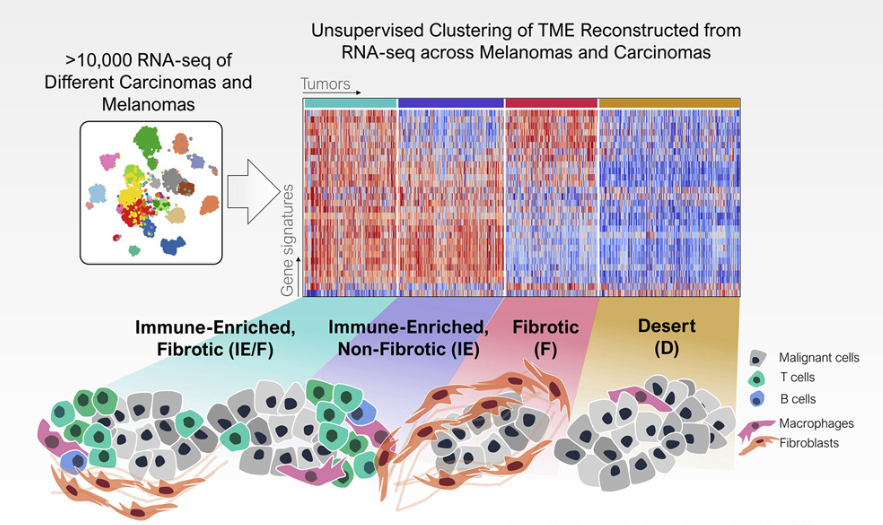
Cancers have four main types of tumor microenvironment; the Immune type survives best.

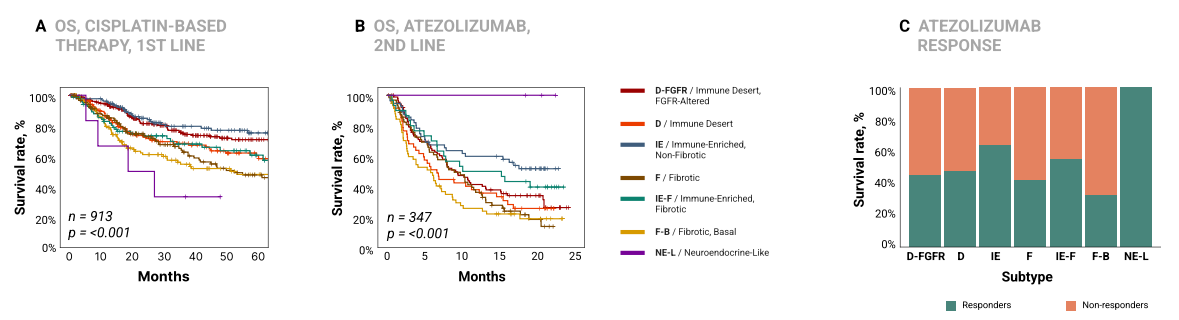
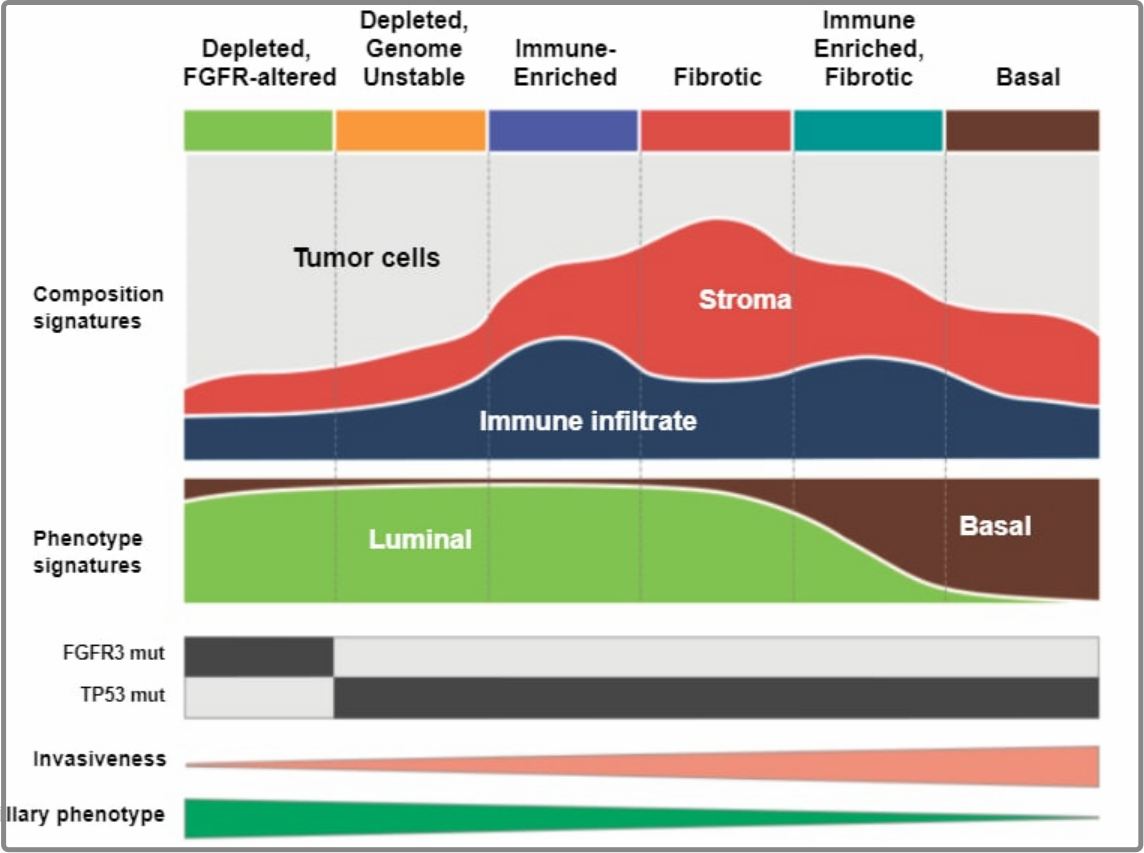
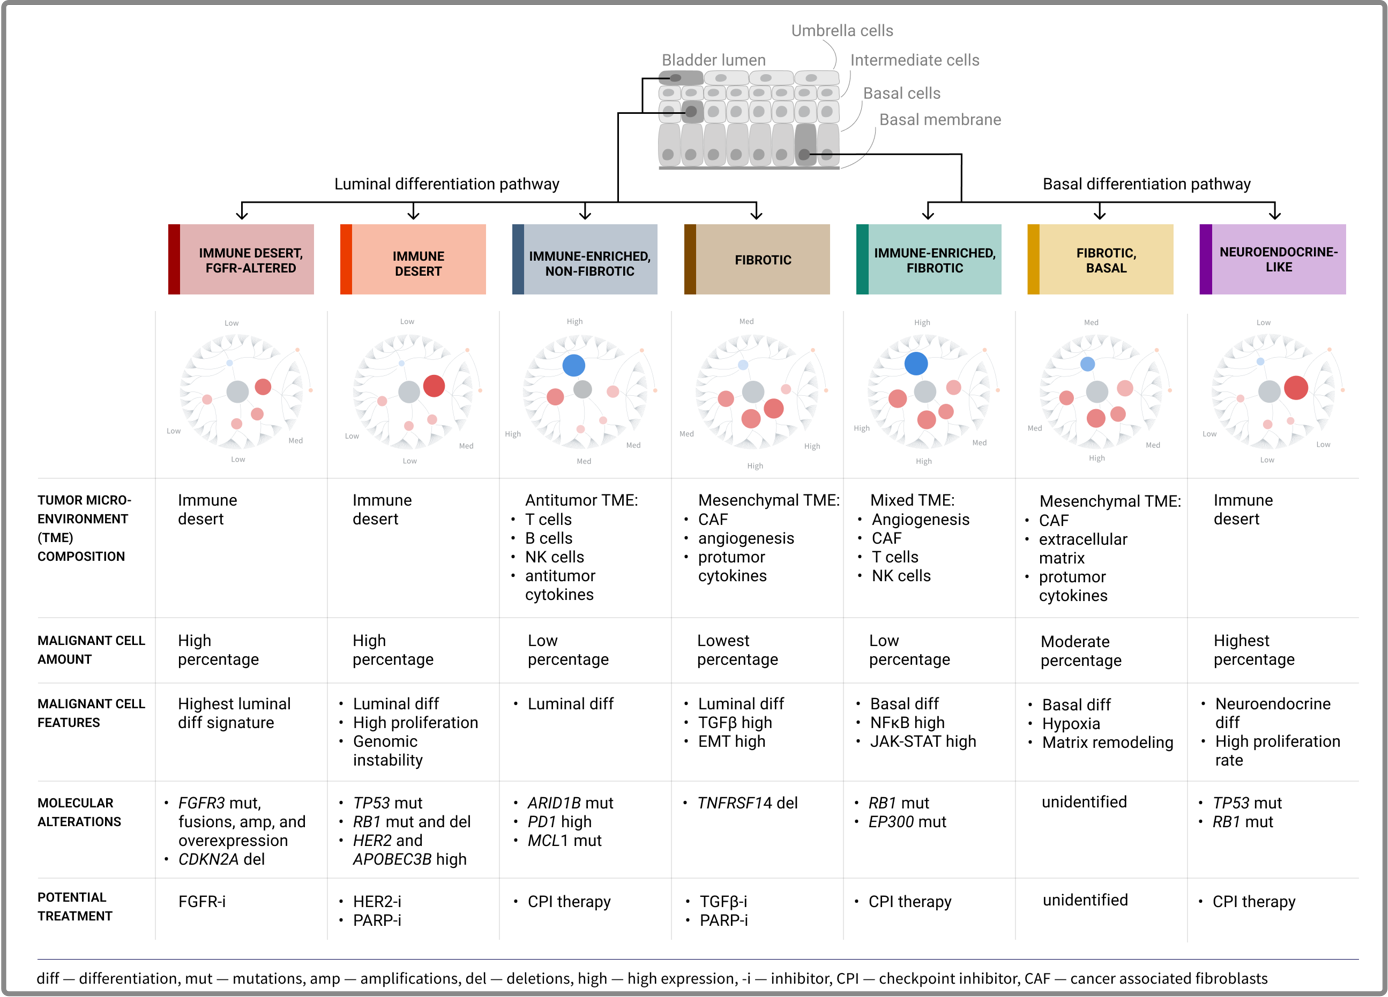
I decided to combine the approaches and take into account both the tumor microenvironment and the properties of malignant cells. I experimented with publicly available data. I ended up with seven subtypes. The subtypes correlate with clinicopathological properties such as survival, responses to immunotherapy, metastases and histological subtype.

A heatmap showing the activity level of microenvironmental processes and cancer cell processes. Red means high activity. Patients are arranged horizontally, processes vertically. The heatmap is divided horizontally into seven subtypes and vertically into four semantic blocks.

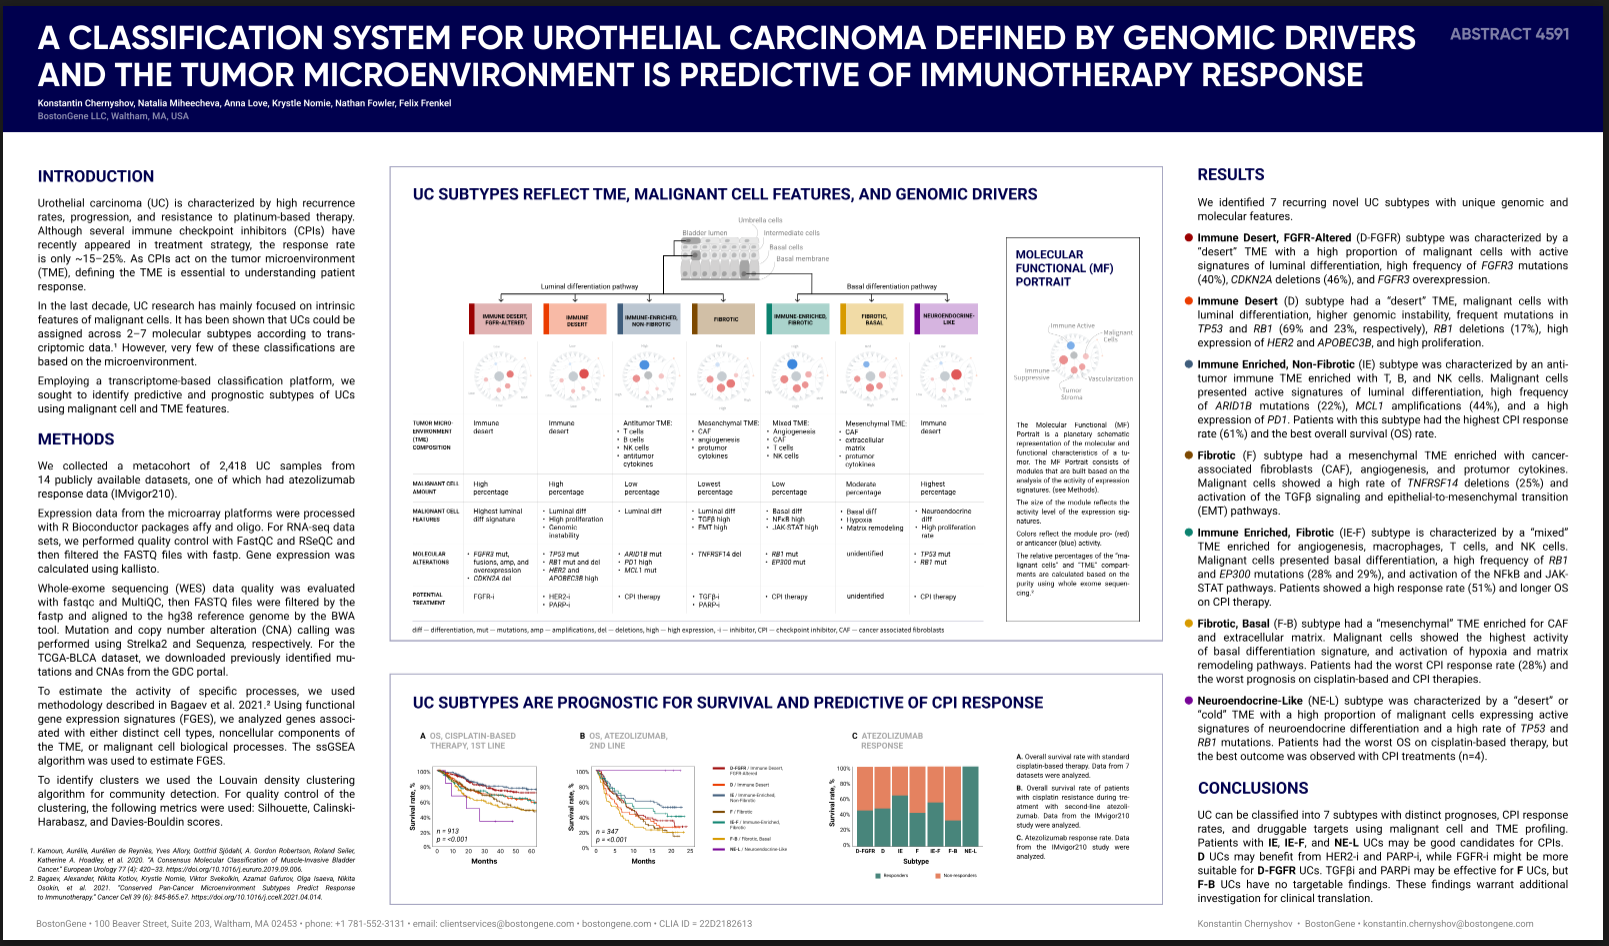
It worked out well and we submitted an abstract to ASCO 2022. The abstract was accepted and by May I had to draw a poster. This is a clinical conference, so the monstrous heatmaps need to be simplified.

  1. I drew it as a cartoon, sorted by luminal-basal activity; the visualization helped to understand some patterns
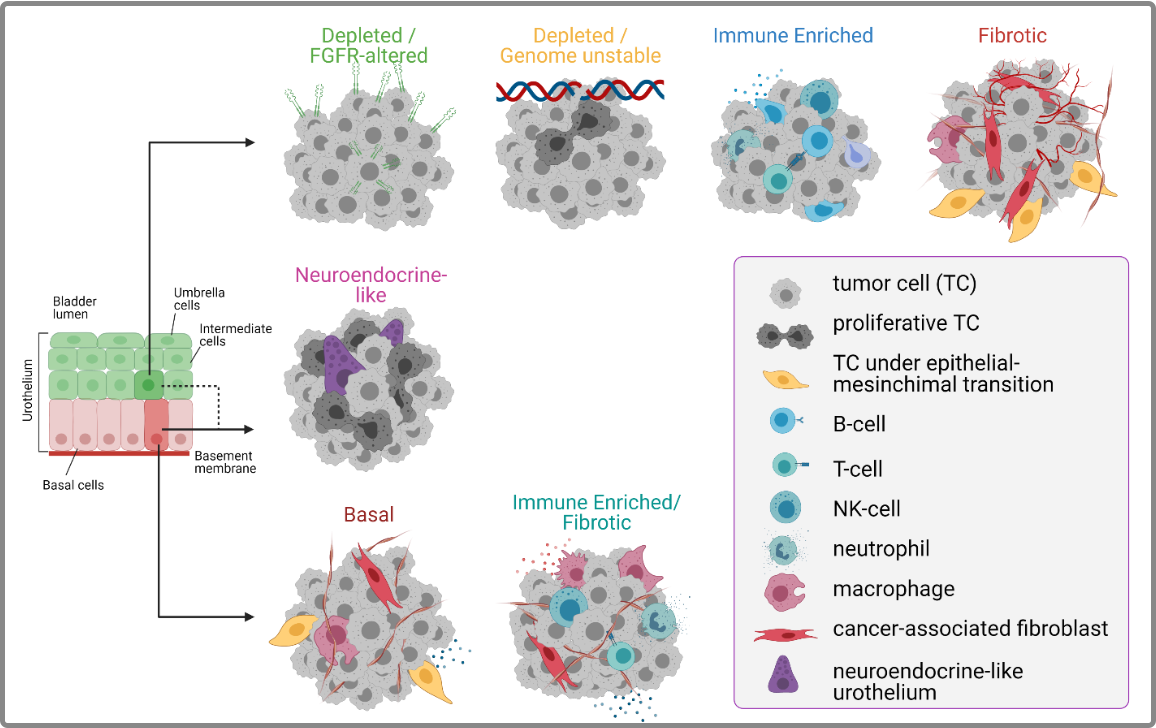
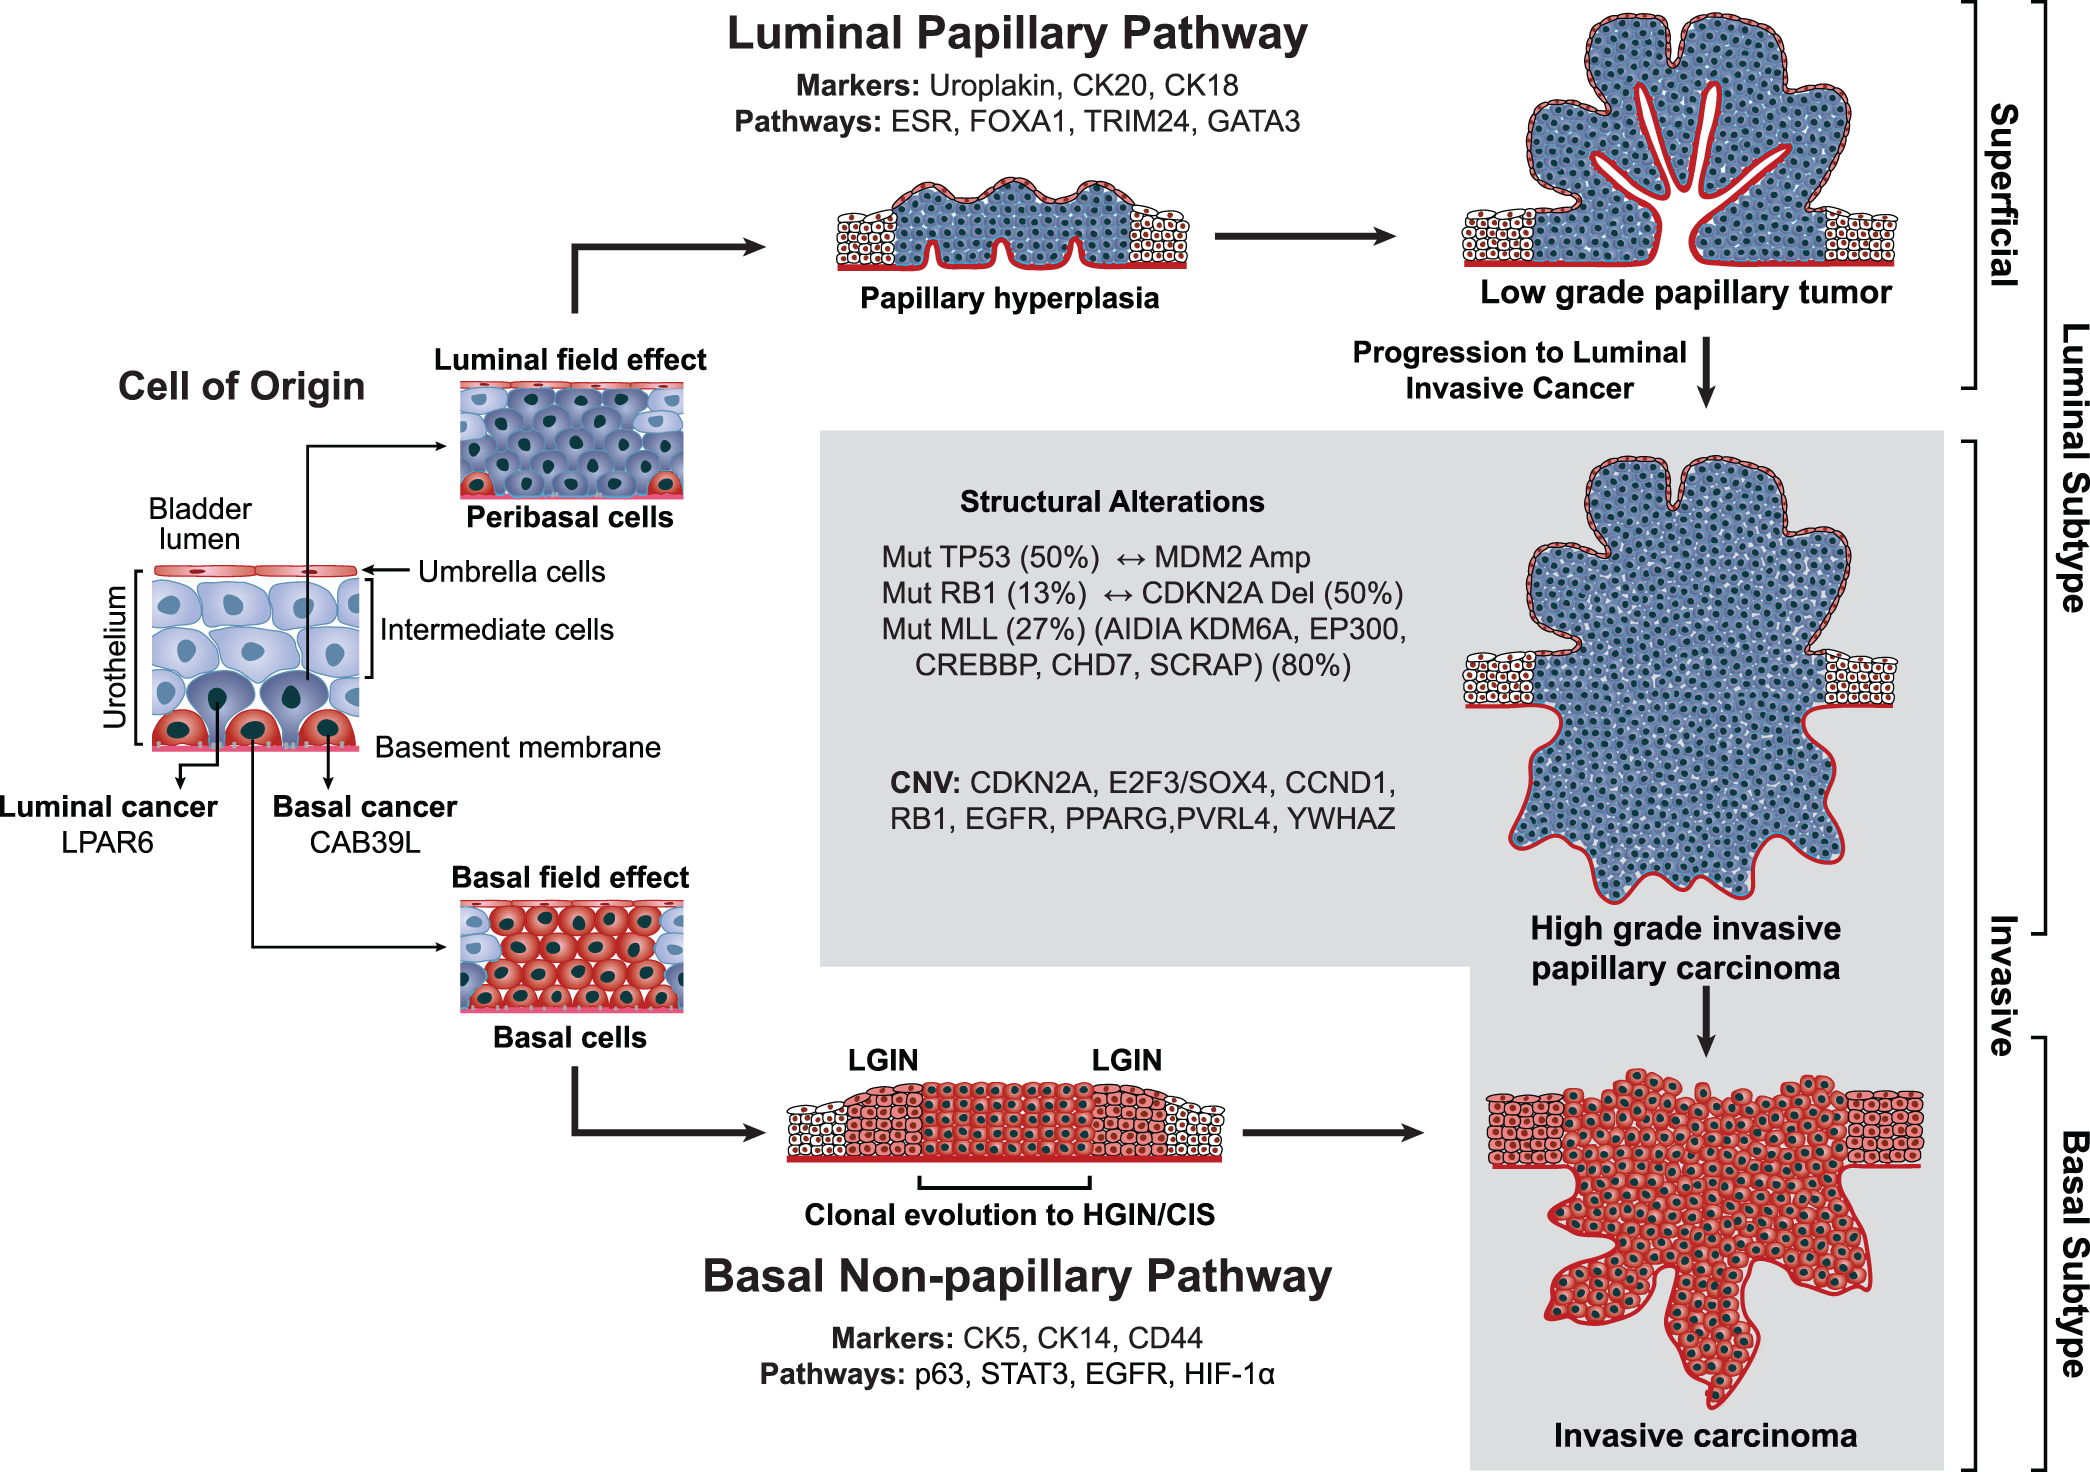
  2. I added the theory that luminal subtypes come from the luminal layer of the urothelium, and basal ones come from the basal layer
  3. I combined these ideas
  4. In the final version I decided to abandon the heatmap, highlighted the most important features in each subtype and simply wrote them in words

I then passed the draft to the designers; they made it beautiful, and the editors helped with the text. The result is a cool poster that we submitted to ASCO 2022 and to Japan at JCA 2022.

Publications in 2023

Part of a bioinformatician’s work in a biotech company is scientific research on topical subjects that the R&D department develops itself or at the client’s request. Participating in conferences allows us to show ourselves as experts in the field, make new acquaintances and start projects.

In 2023 I started as a bioinformatician and finished as the head of a small group. Therefore, roughly the first half of the year I did projects from start to finish — understanding the task, formulating and testing hypotheses, statistical analysis and visualization, writing the draft text and figures. In the second half of the year I did less myself and focused more on leading and quality control. Below are selected projects.

American Society of Clinical Oncology

The main clinical oncology conference in the USA.

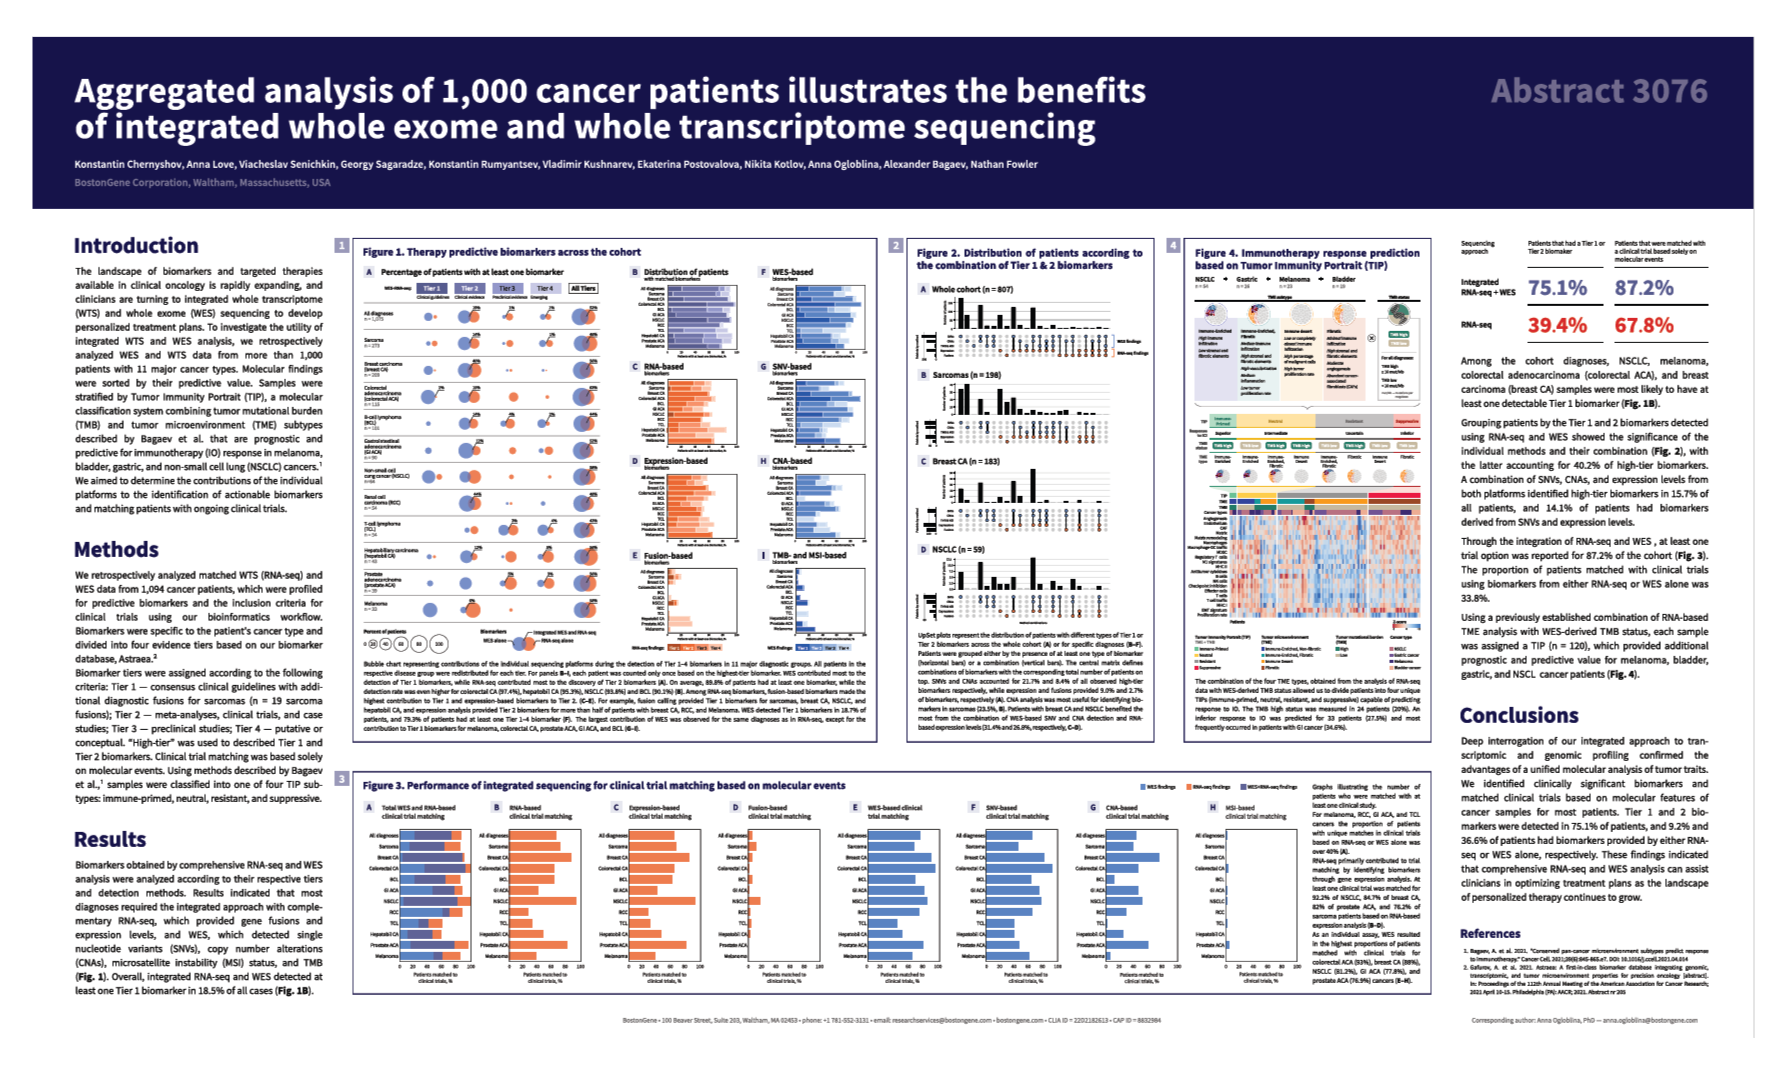
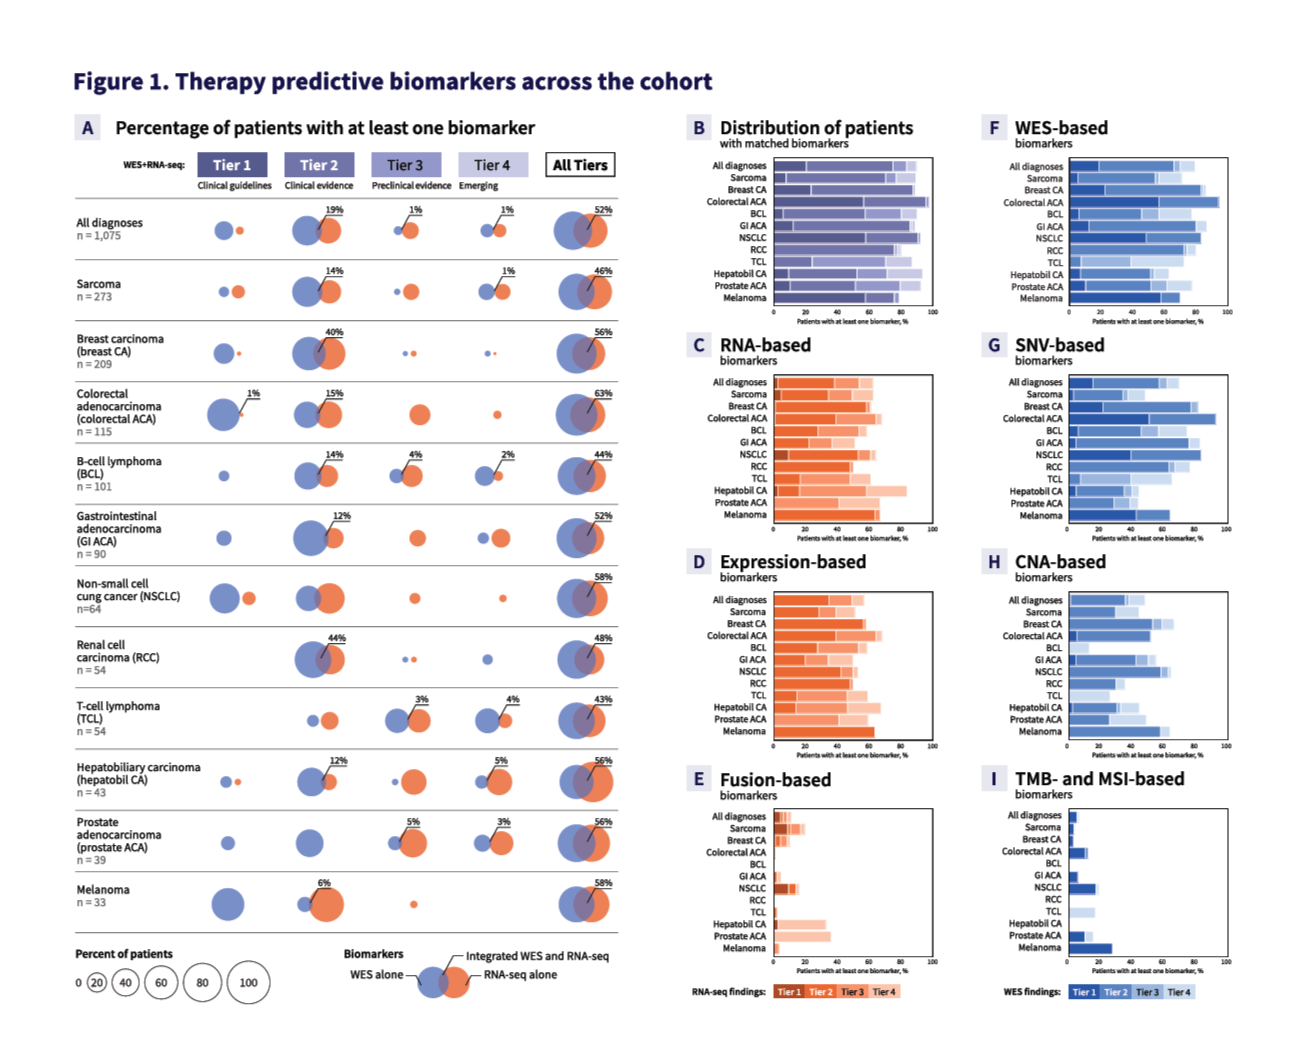
“Aggregated analysis of 1,000 patients with cancer to assess the benefits of integrated whole exome and whole transcriptome sequencing”.
ASCO abstract compendium.
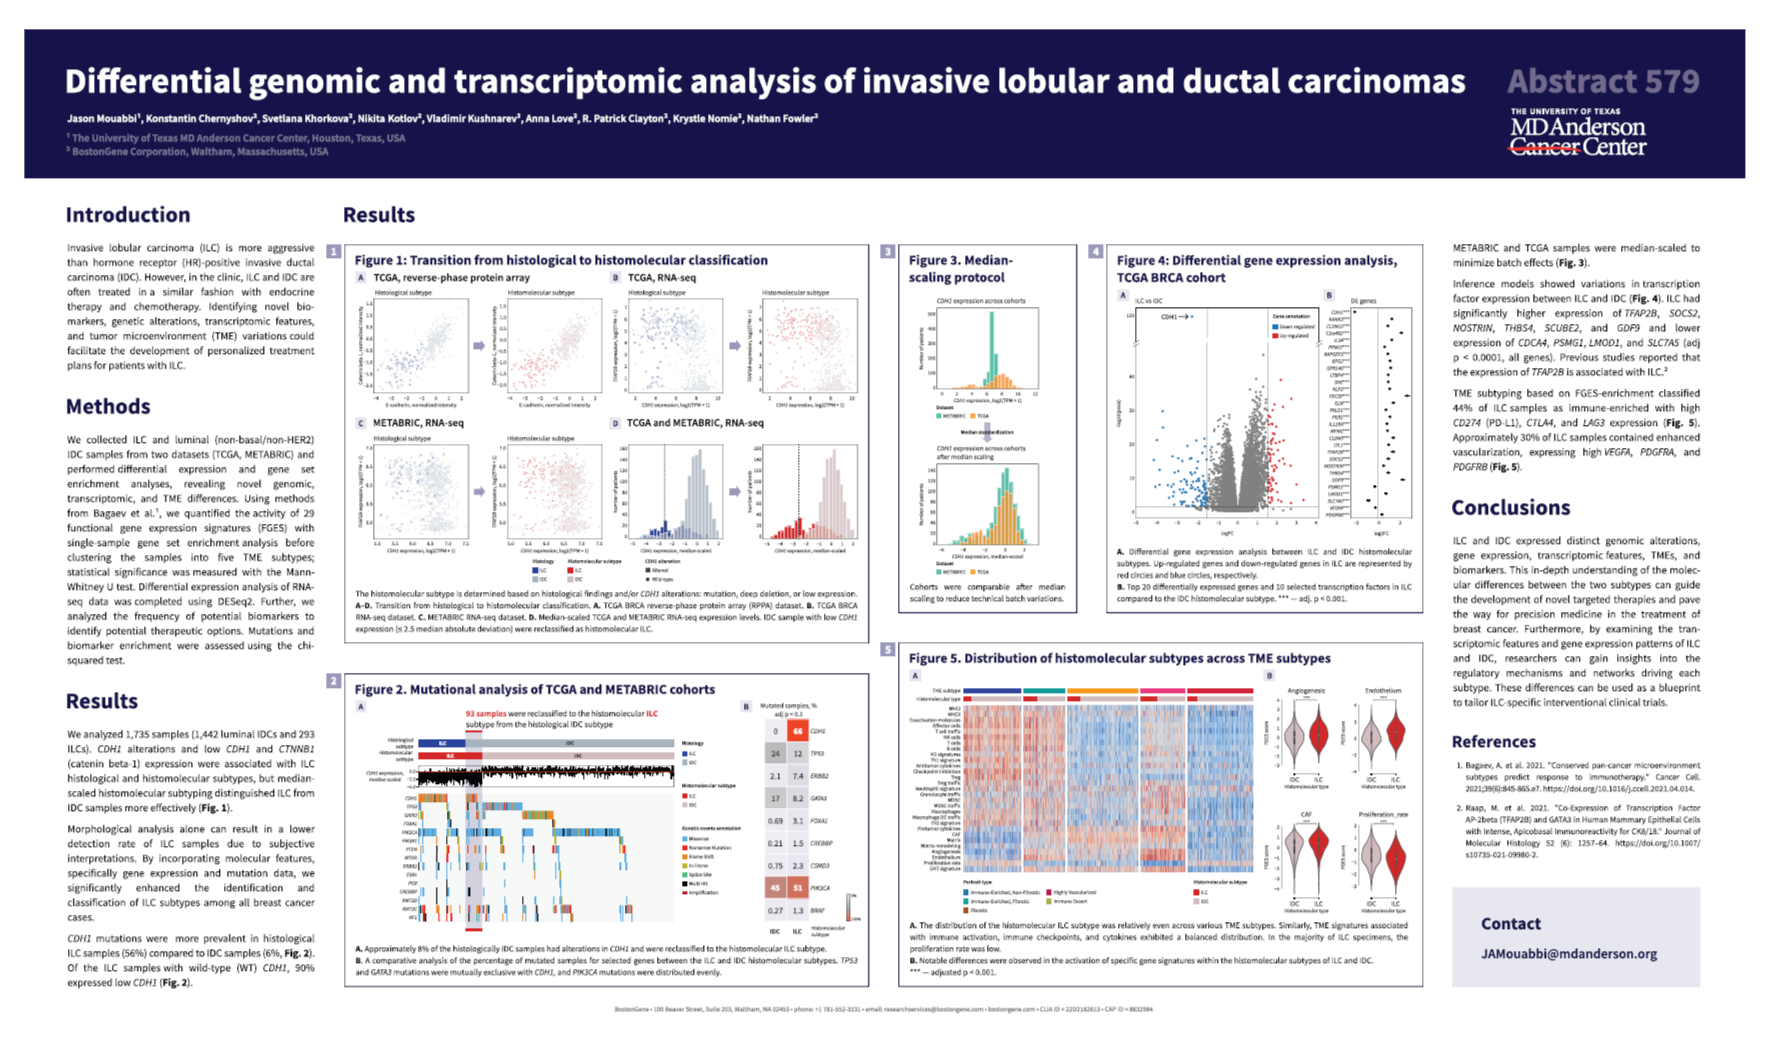
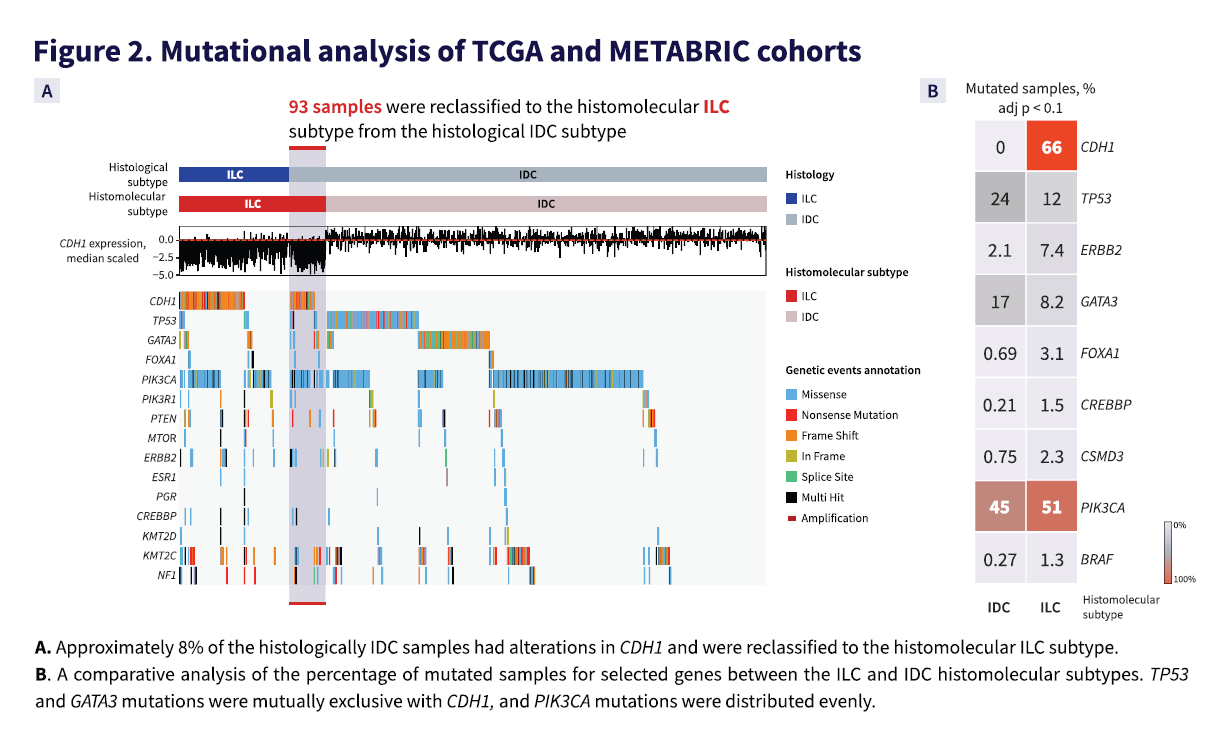
“Differential genomic and transcriptomic analysis of invasive lobular and ductal carcinomas”.
ASCO abstract compendium.

San-Antonio Breast Cancer Symposium

The largest breast cancer conference in the world, held in San Antonio.
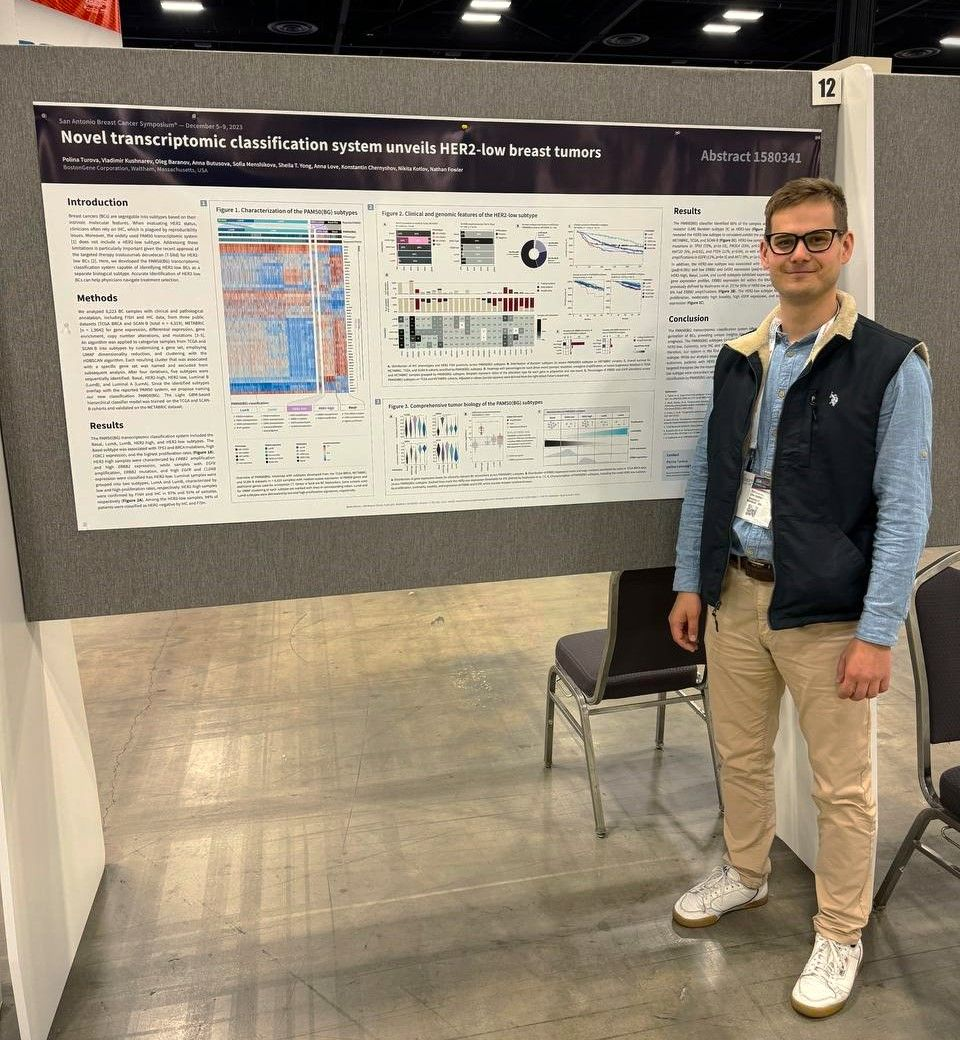
I was even there, read the travel notes.

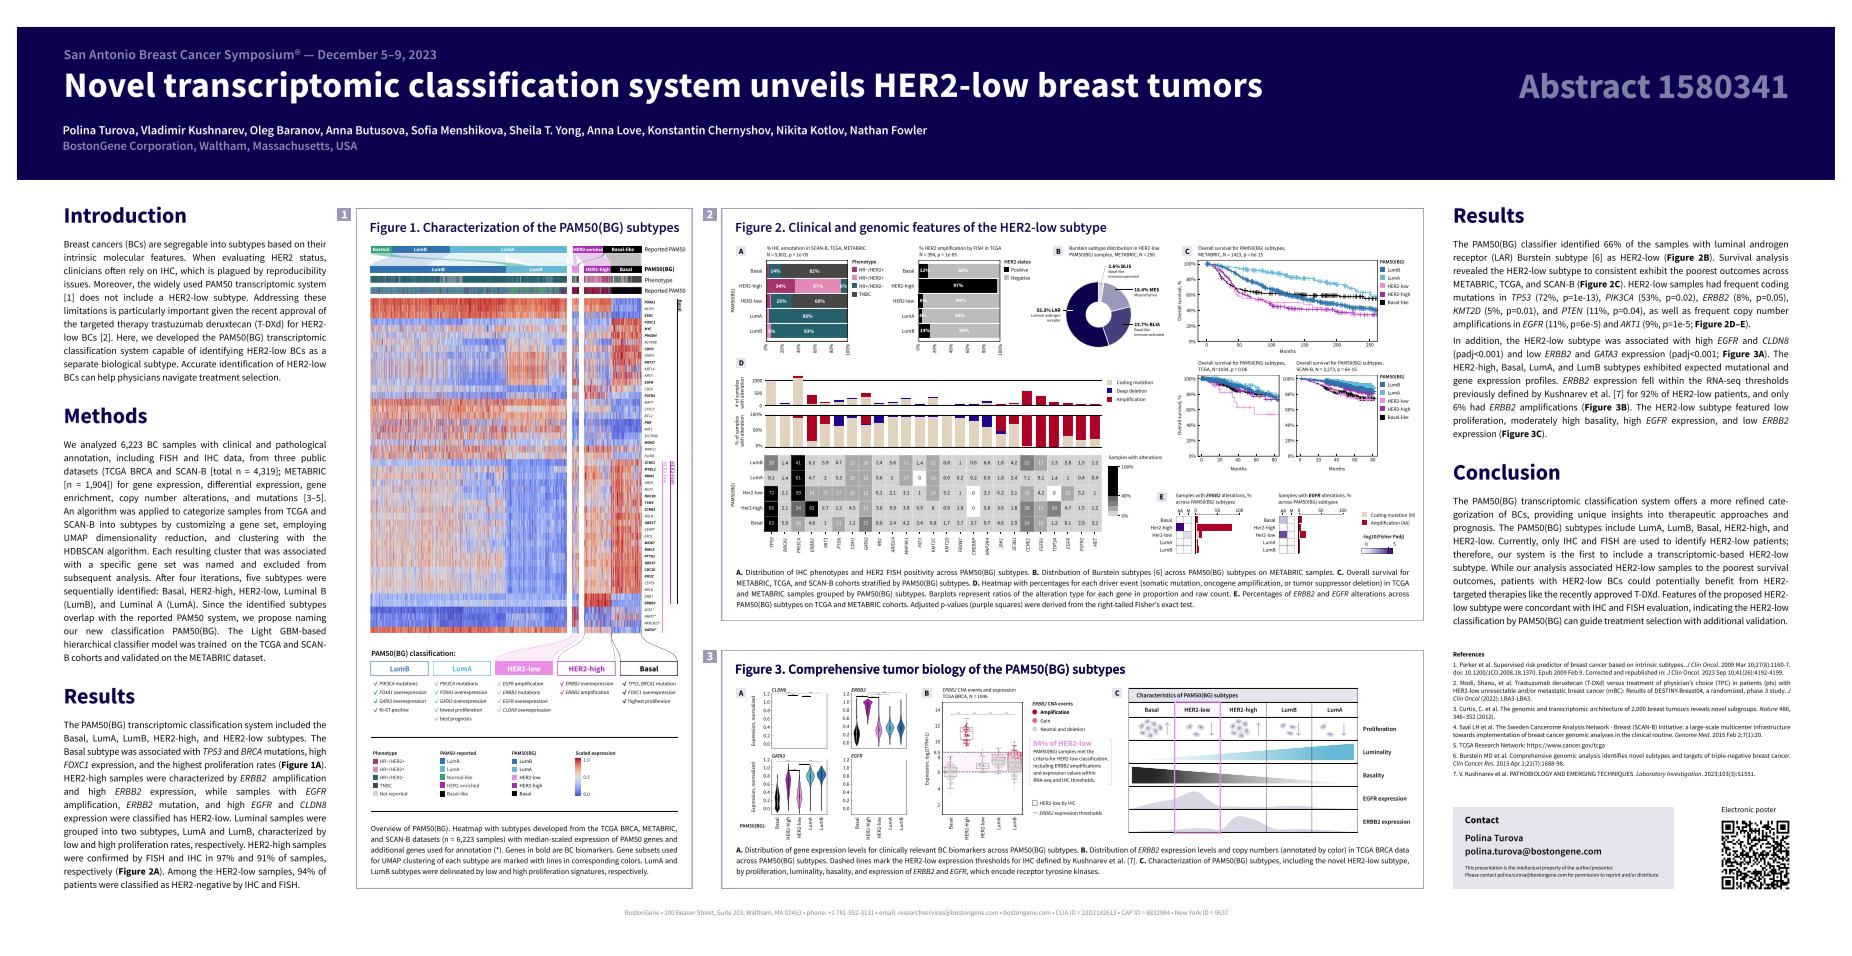
“Novel Transcriptomic Classification System Unveils HER2-Low Breast Tumors”.
SABCS abstract compendium.

Publications in 2024

In 2024, I worked as the head of a group of bioinformaticians at BostonGene. Part of our department’s work involves scientific research on topical subjects that we either generate ourselves or receive as a client request. Participating in conferences allows us to present ourselves as experts in the field, make new acquaintances, and start projects.

As a project lead, I proposed research topics, kept track of deadlines and workloads. Below are selected projects.

American Society of Clinical Oncology

The main clinical oncology conference in the USA.

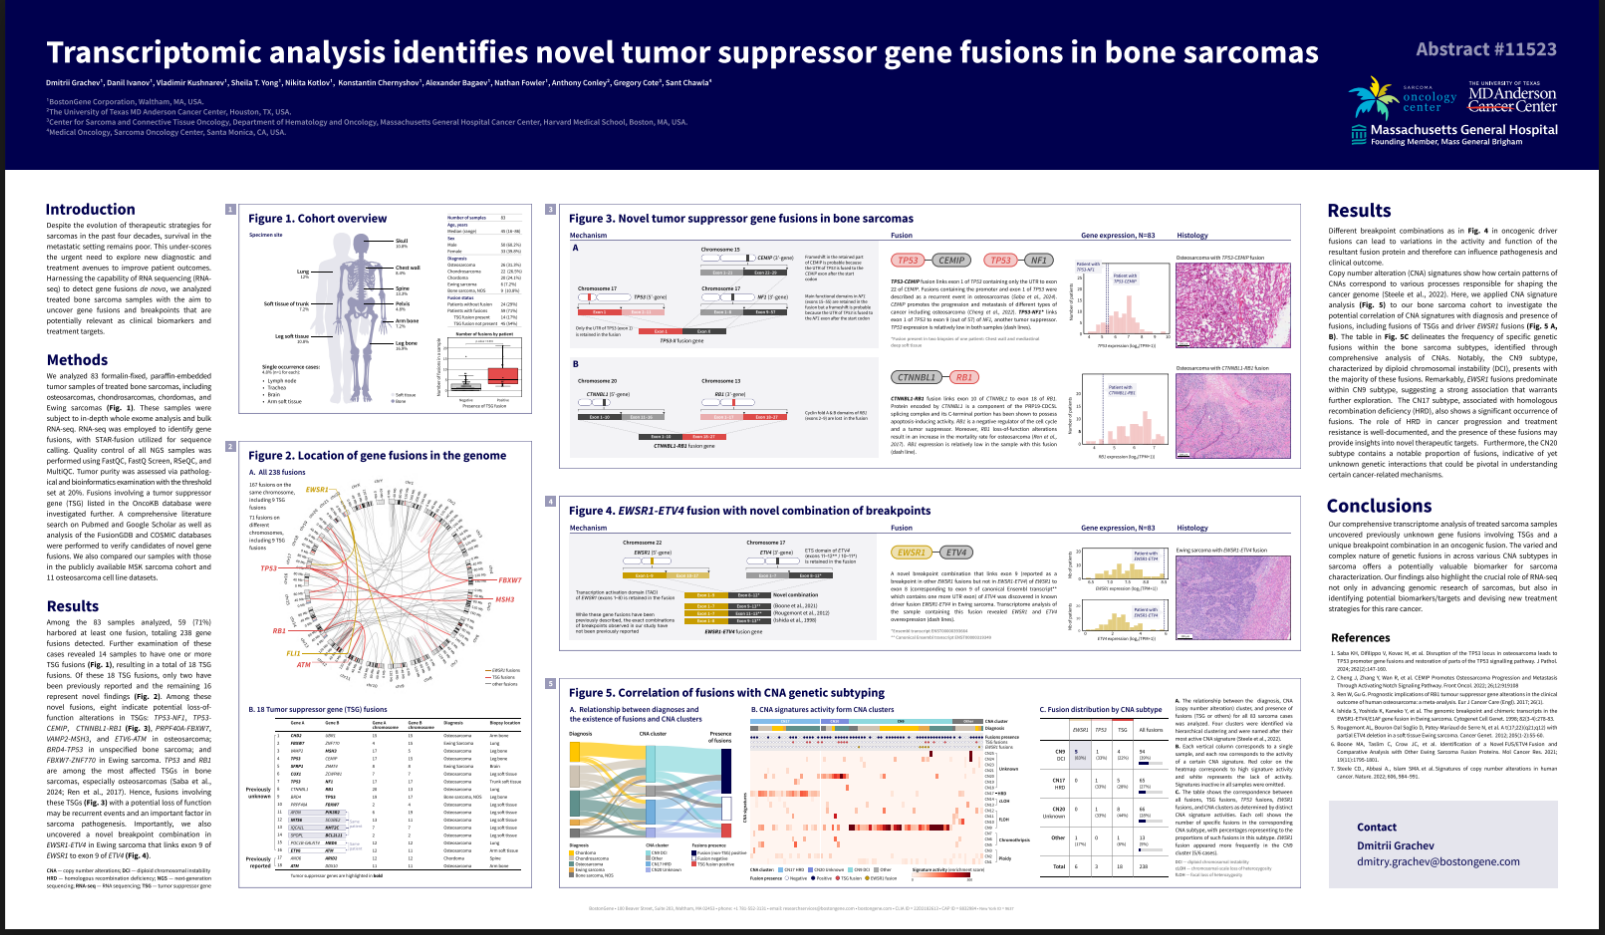
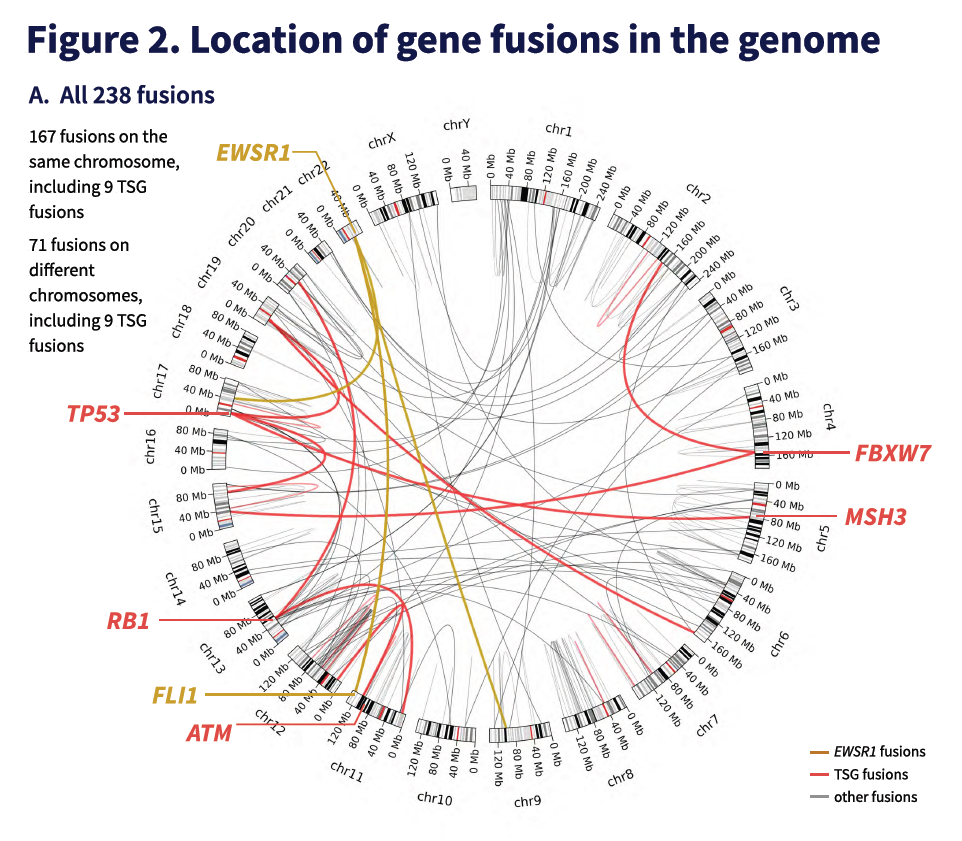
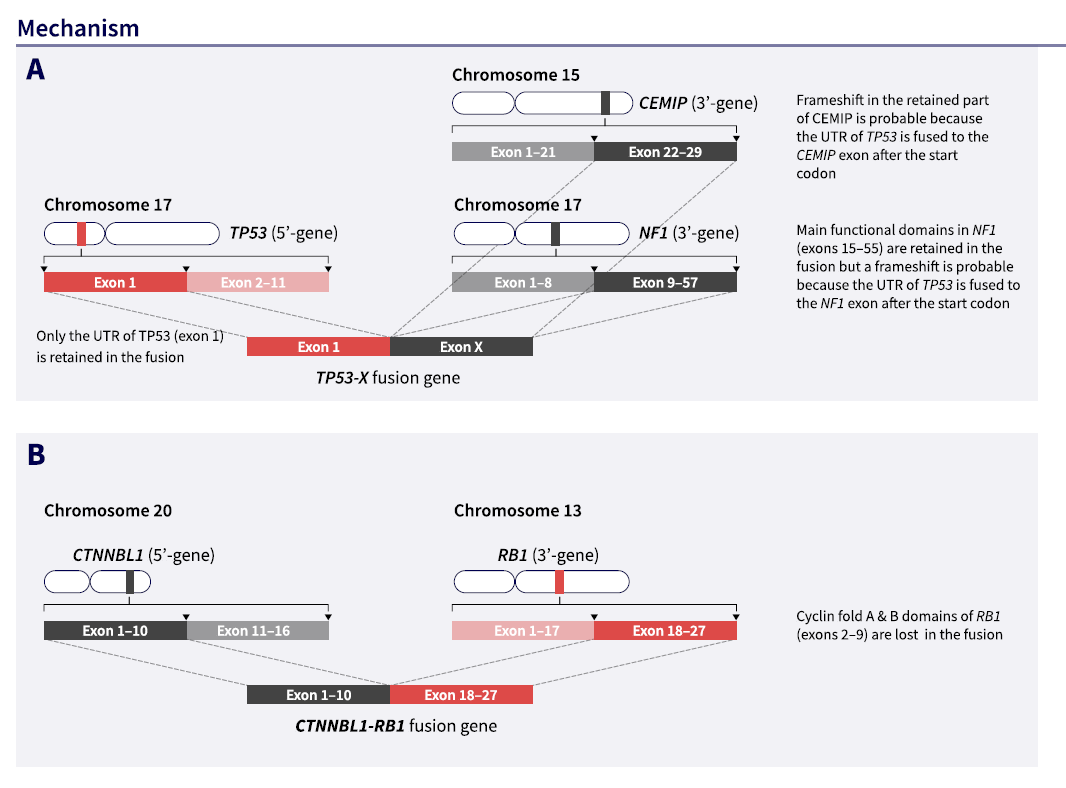
“Transcriptomic Analysis Identifies Novel Tumor Suppressor Gene Fusions in Bone Sarcomas”.
ASCO abstracts.

Society of Immunotherapy of Cancer

The largest conference on cancer immunotherapy; this year it took place in Barcelona.

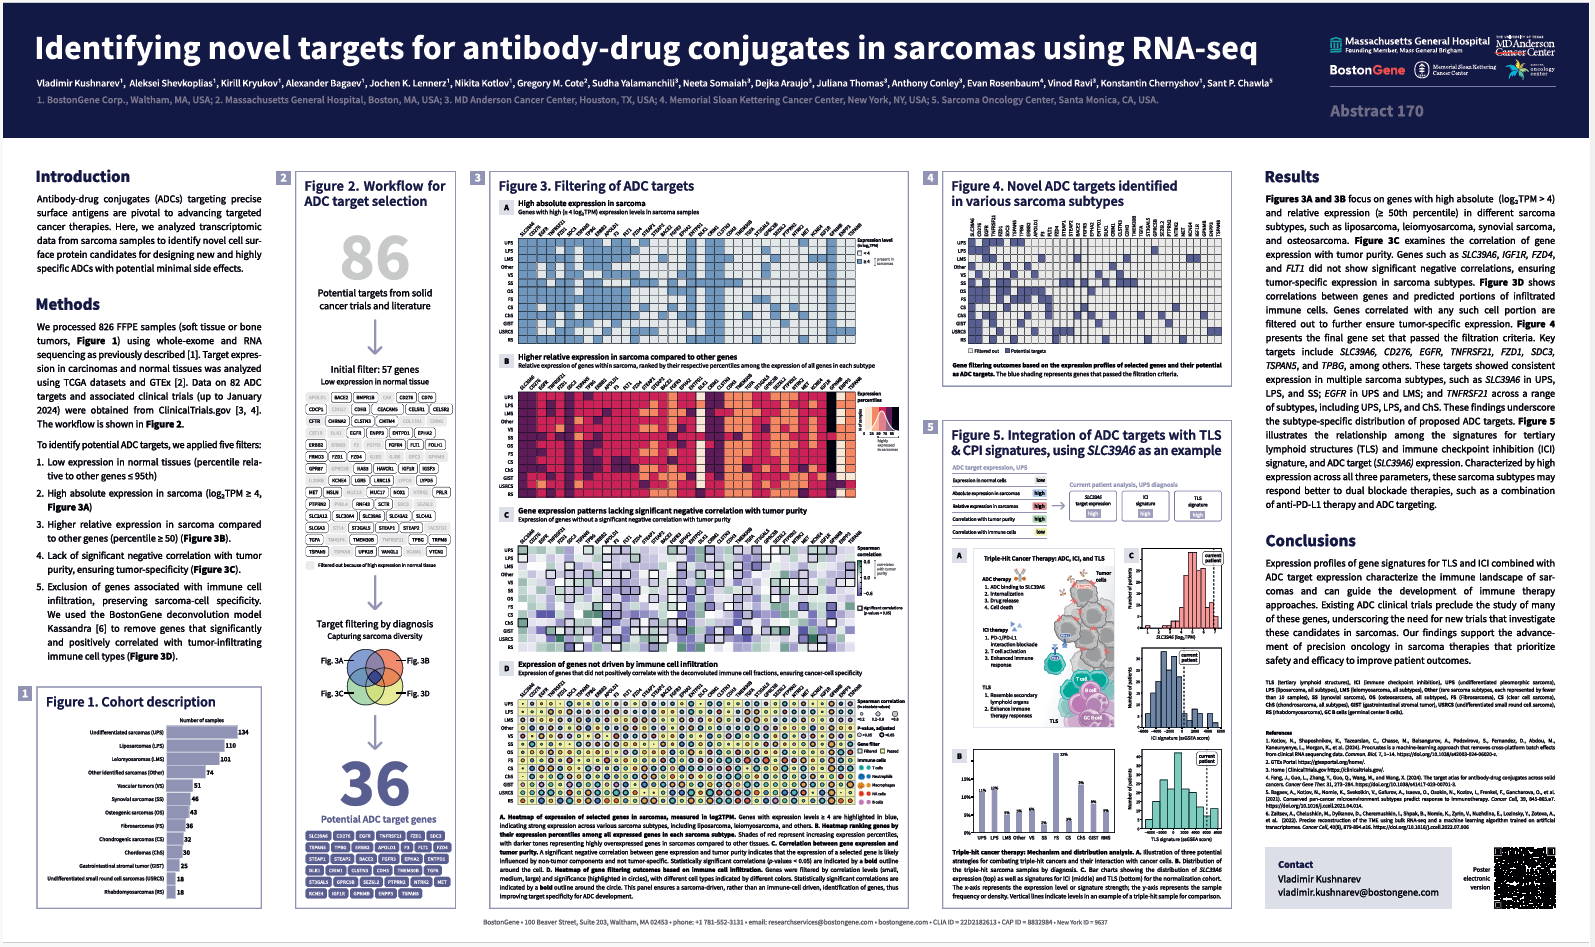
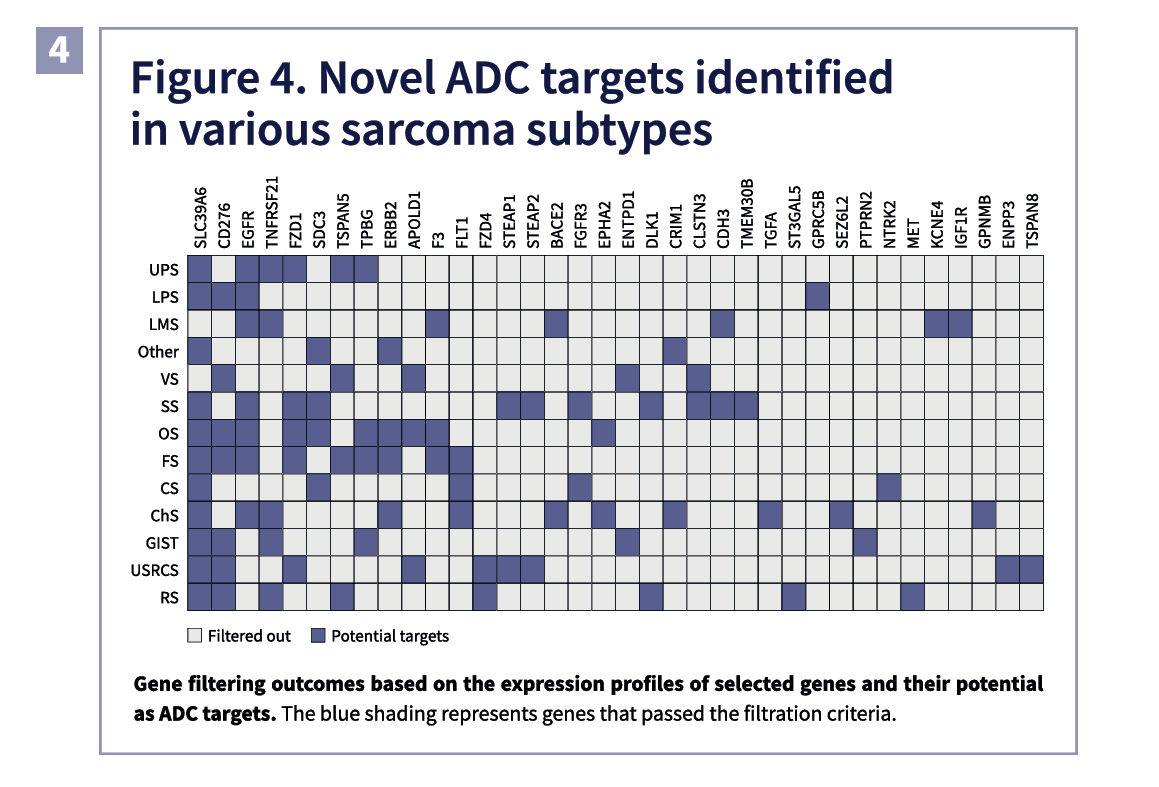
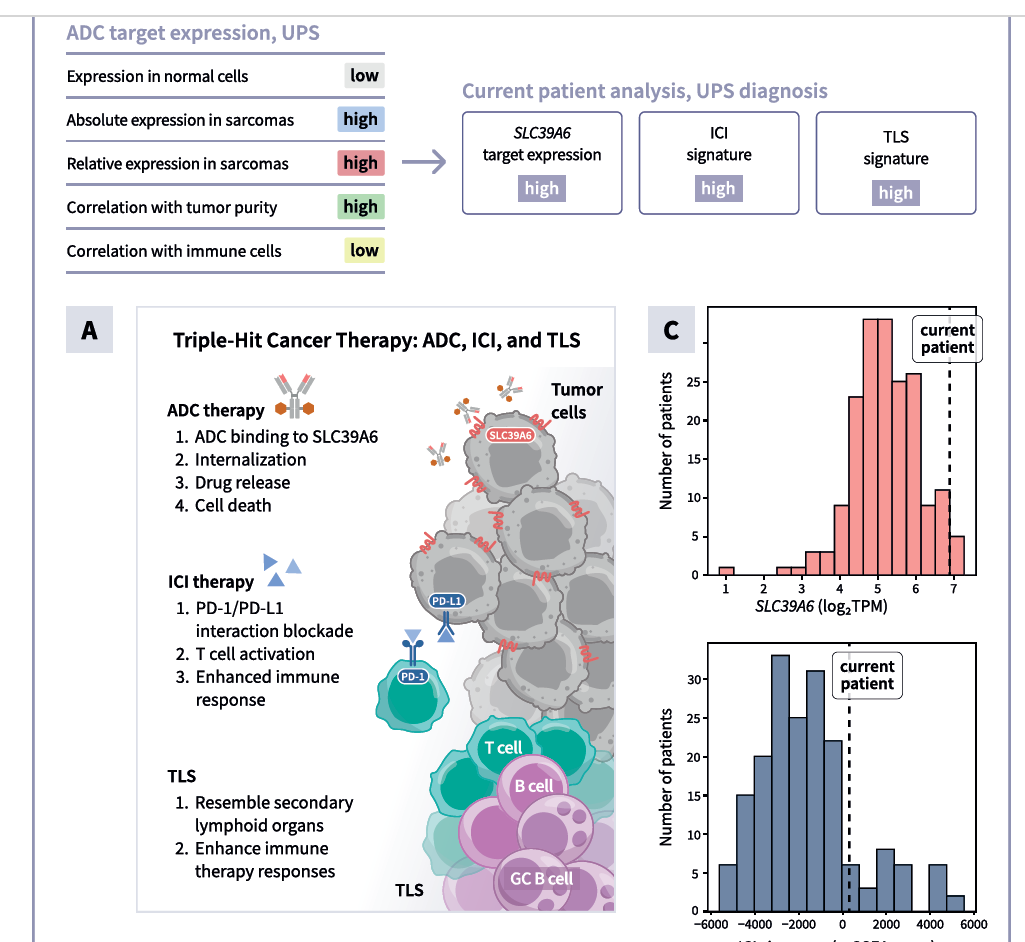
“Identifying novel targets for antibody-drug conjugates in sarcomas using RNA sequencing”.
BostonGene news.
SITC abstracts.

Association of Molecular Pathology

A large conference in Canada attended by pathologists, pharma and biotech.

“Comparative Molecular Analysis of Clear Cell Sarcoma and Cutaneous Melanomas: Key Genetic Insights for diagnosis”. BostonGene news.
APM abstracts.

American Society of Hematology

The largest conference on lymphomas and blood disorders in the world.

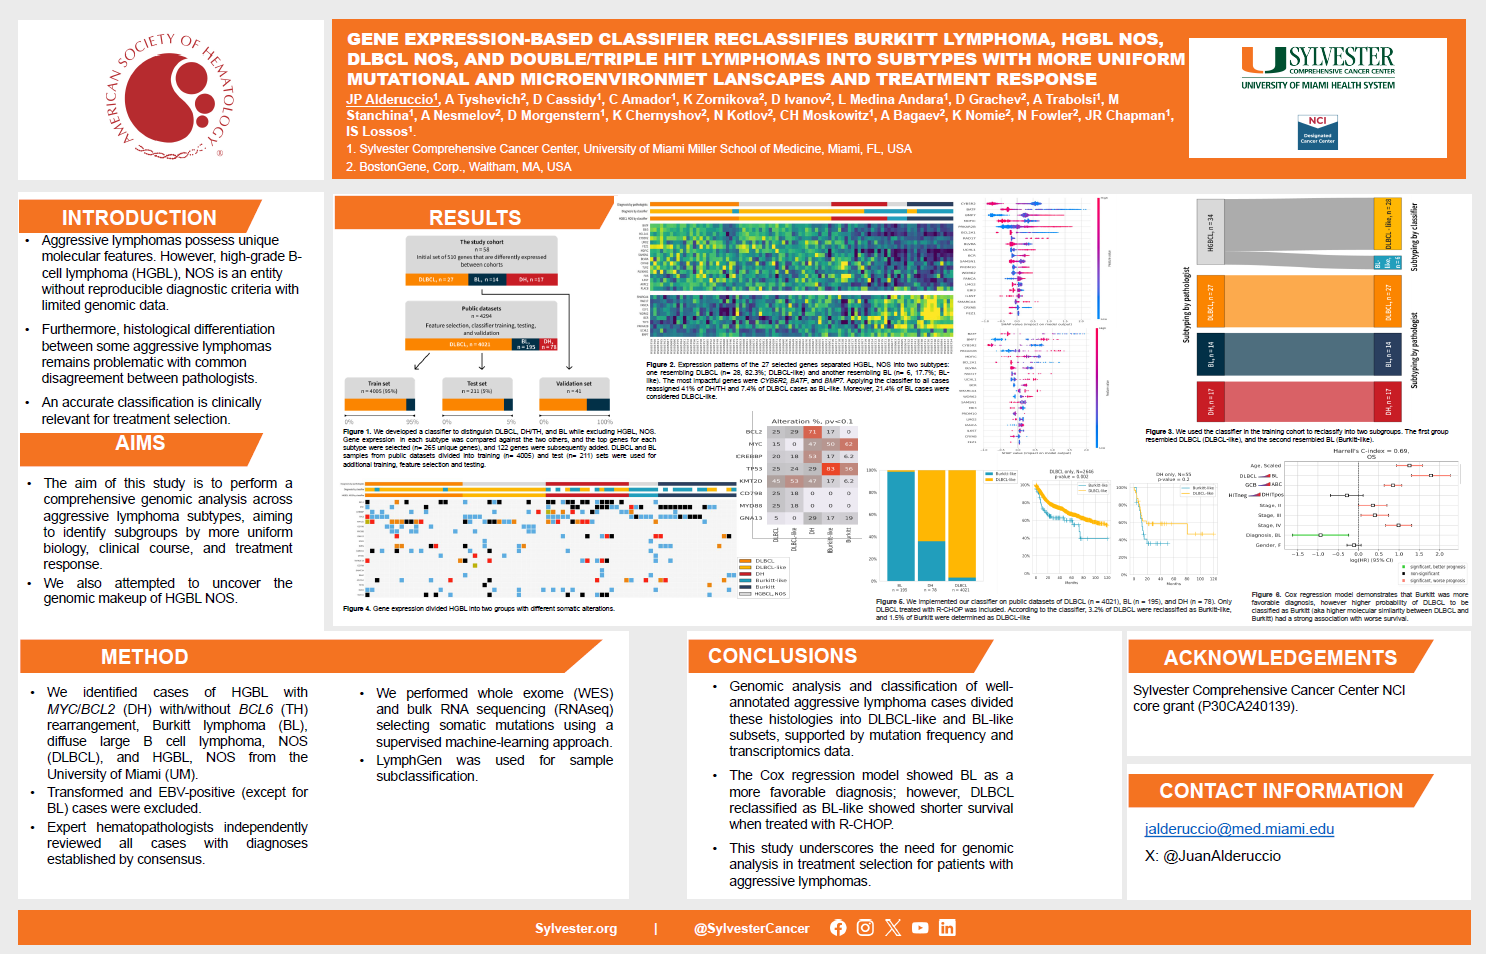
“Gene Expression-Based Classifier Reclassifies Burkitt Lymphoma, HGBL NOS, DLBCL NOS, and Double/Triple Hit Lymphomas into Subtypes with More Mutational and Microenvironment Landscapes and Treatment Response”. BostonGene news.
ASH conference website.

San-Antonio Breast Cancer Symposium

The largest breast cancer conference in the world.

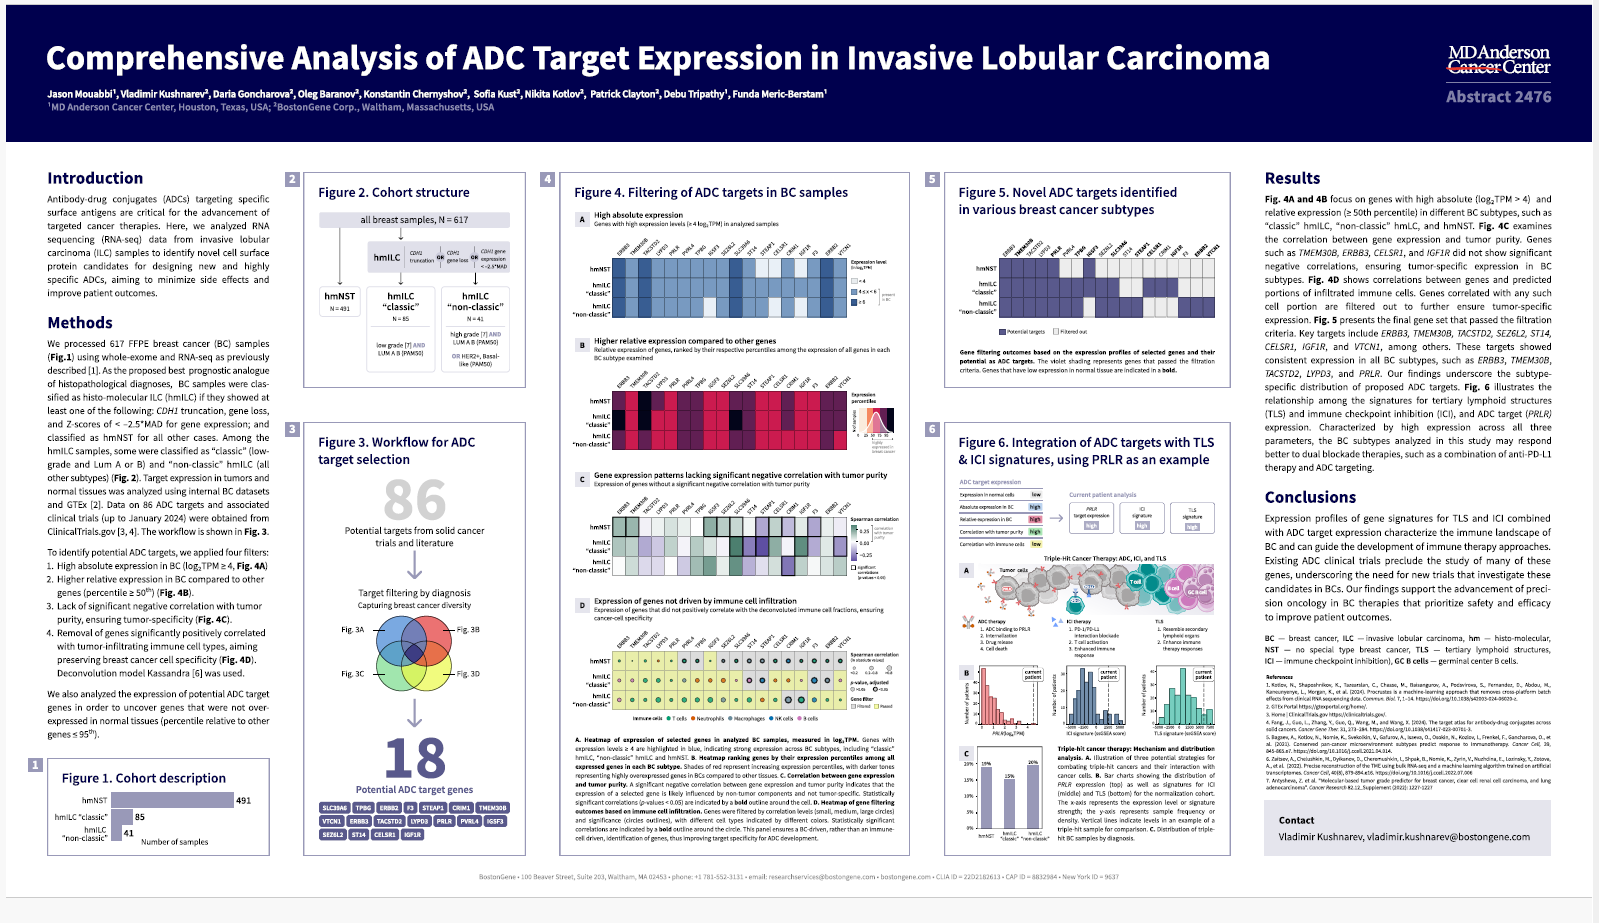
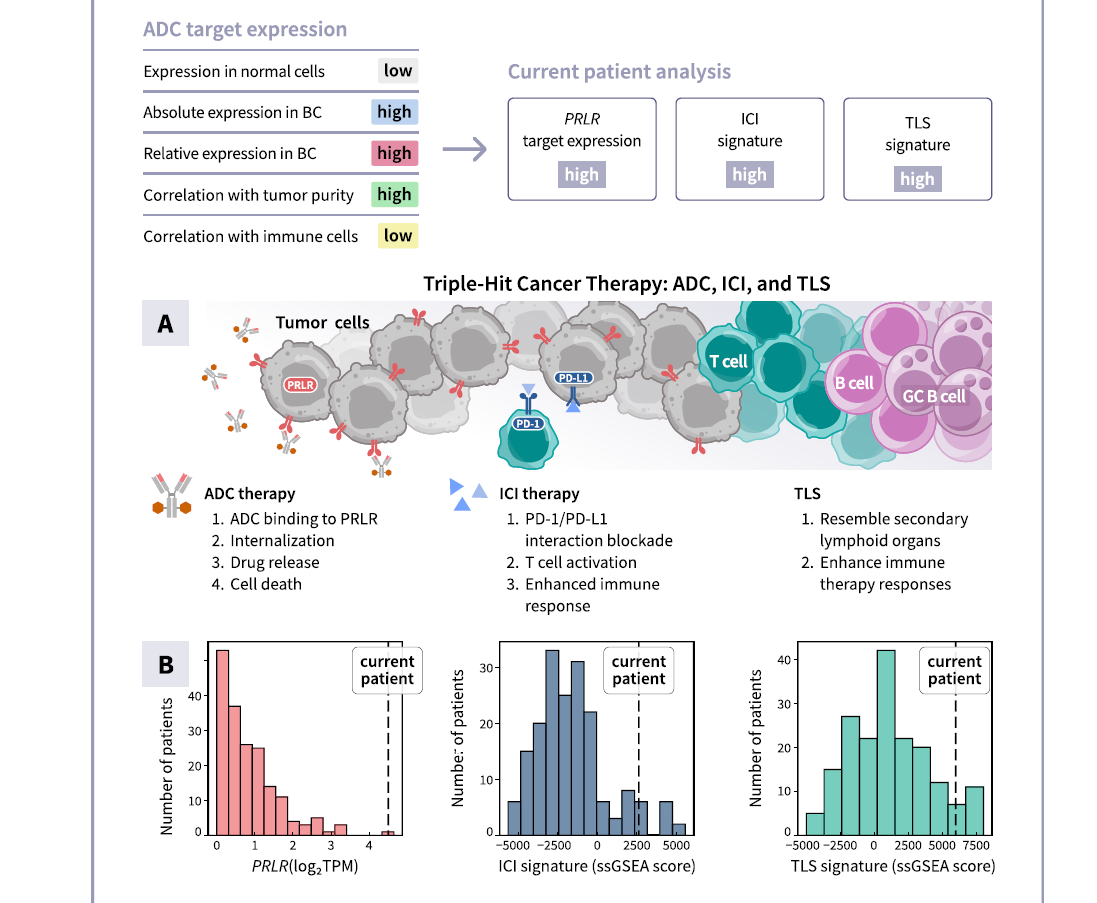
“Comprehensive Analysis of ADC Target Expression in Invasive Lobular Carcinoma”.
BostonGene news.
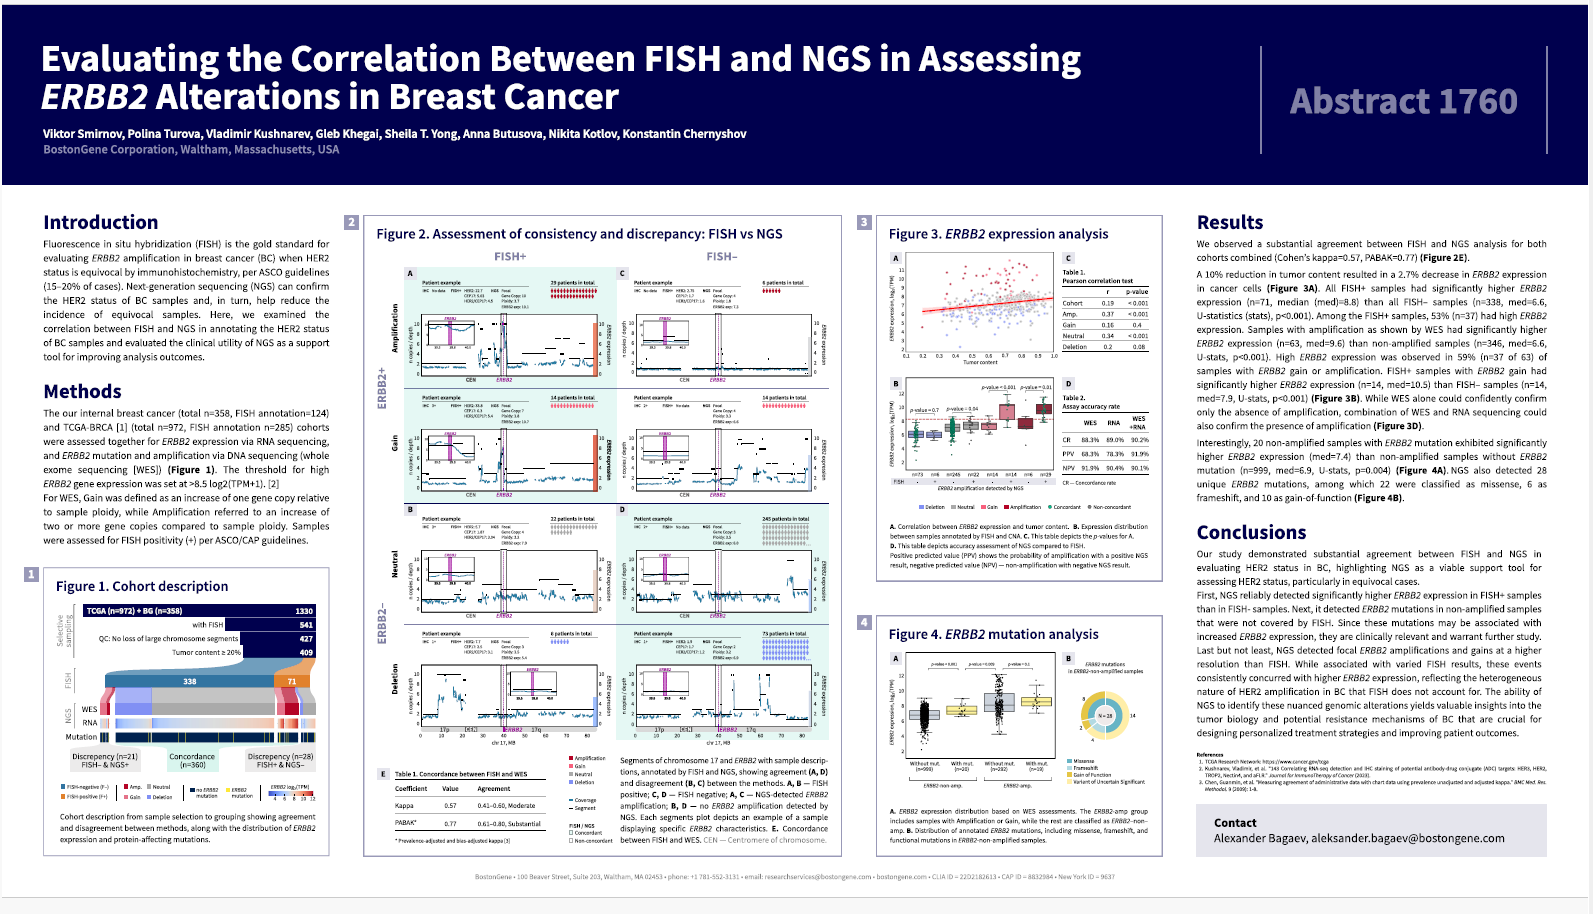
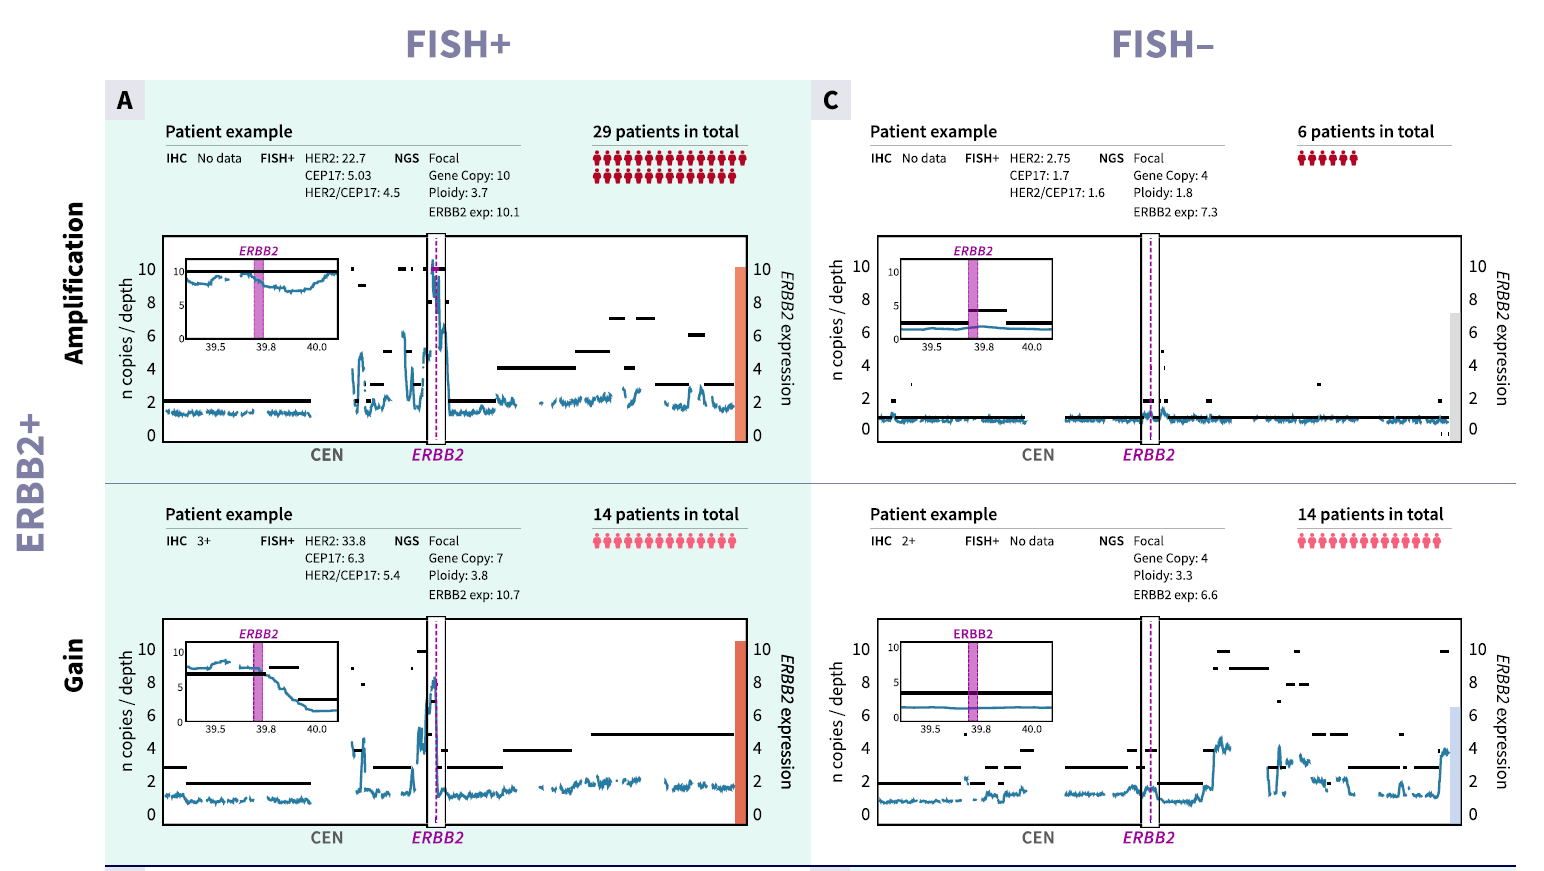
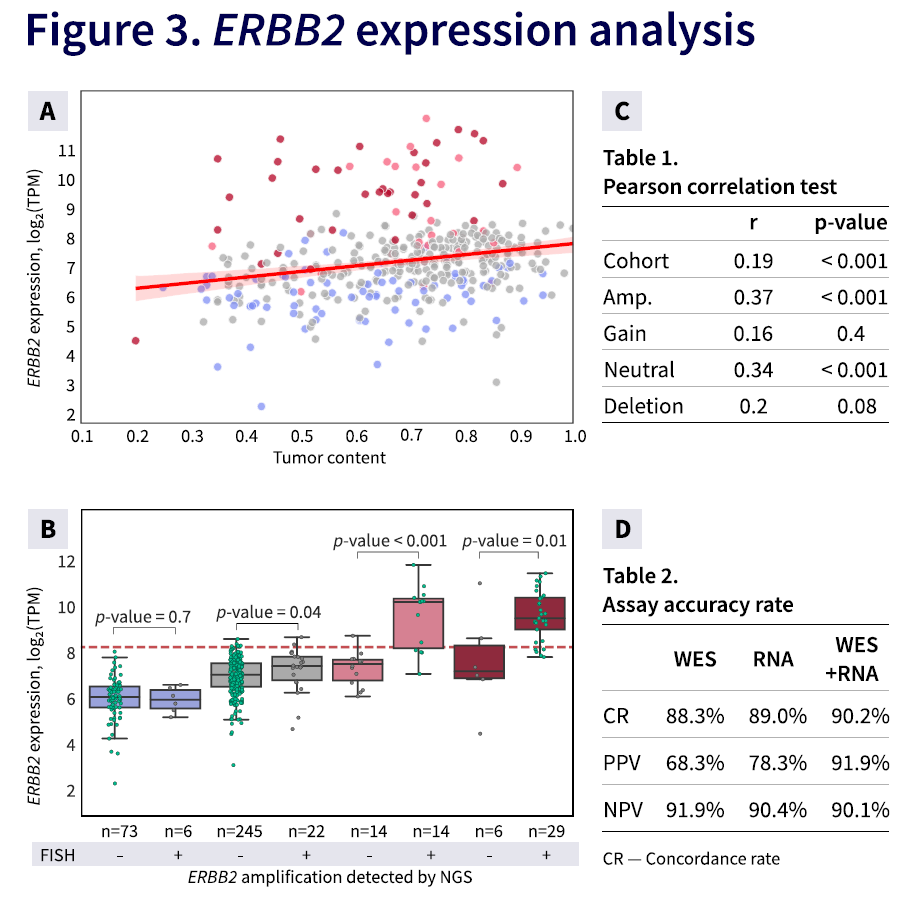
“Evaluating the Correlation Between FISH and NGS in Assessing ERBB2 Amplification in Breast Cancer: Insights and Implications”. BostonGene news.

Publications in 2025

In 2025, I lead a bioinformatics and NGS data analytics department. Over the year, our team supported 26 abstracts and 4 papers — we processed data, formulated and tested hypotheses, ran statistics, created figures, and wrote results and methods. Most of the abstracts were collaborations with clinics and universities, along with a few fully in-house studies. Participating in conferences helps us demonstrate our expertise, build new connections, and start new projects. Below are some of the most interesting examples.

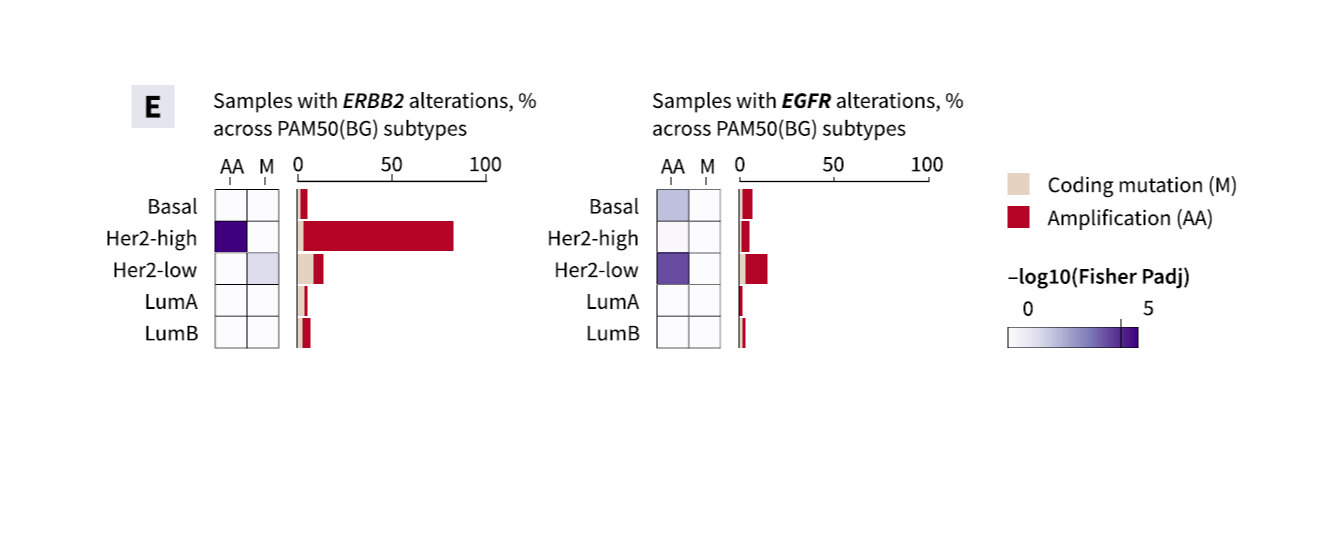
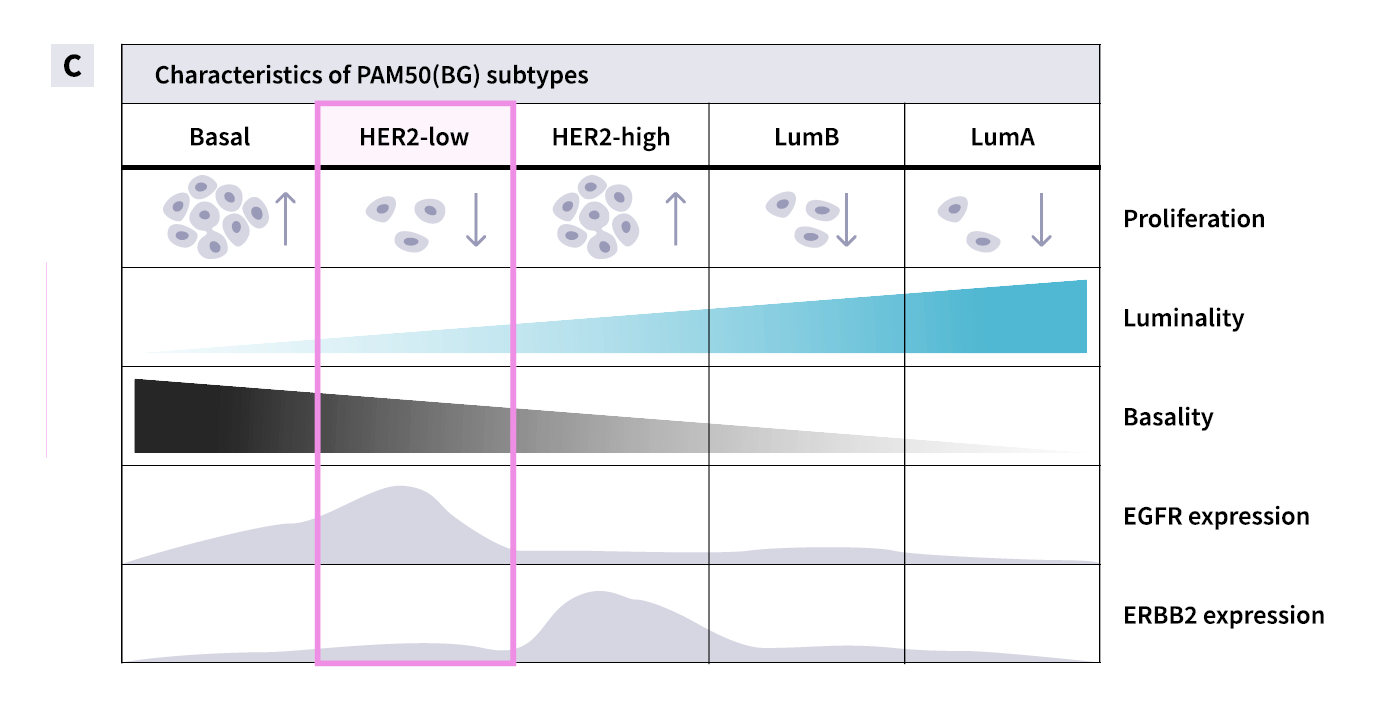
Paper “Breast Cancer Classifier...”

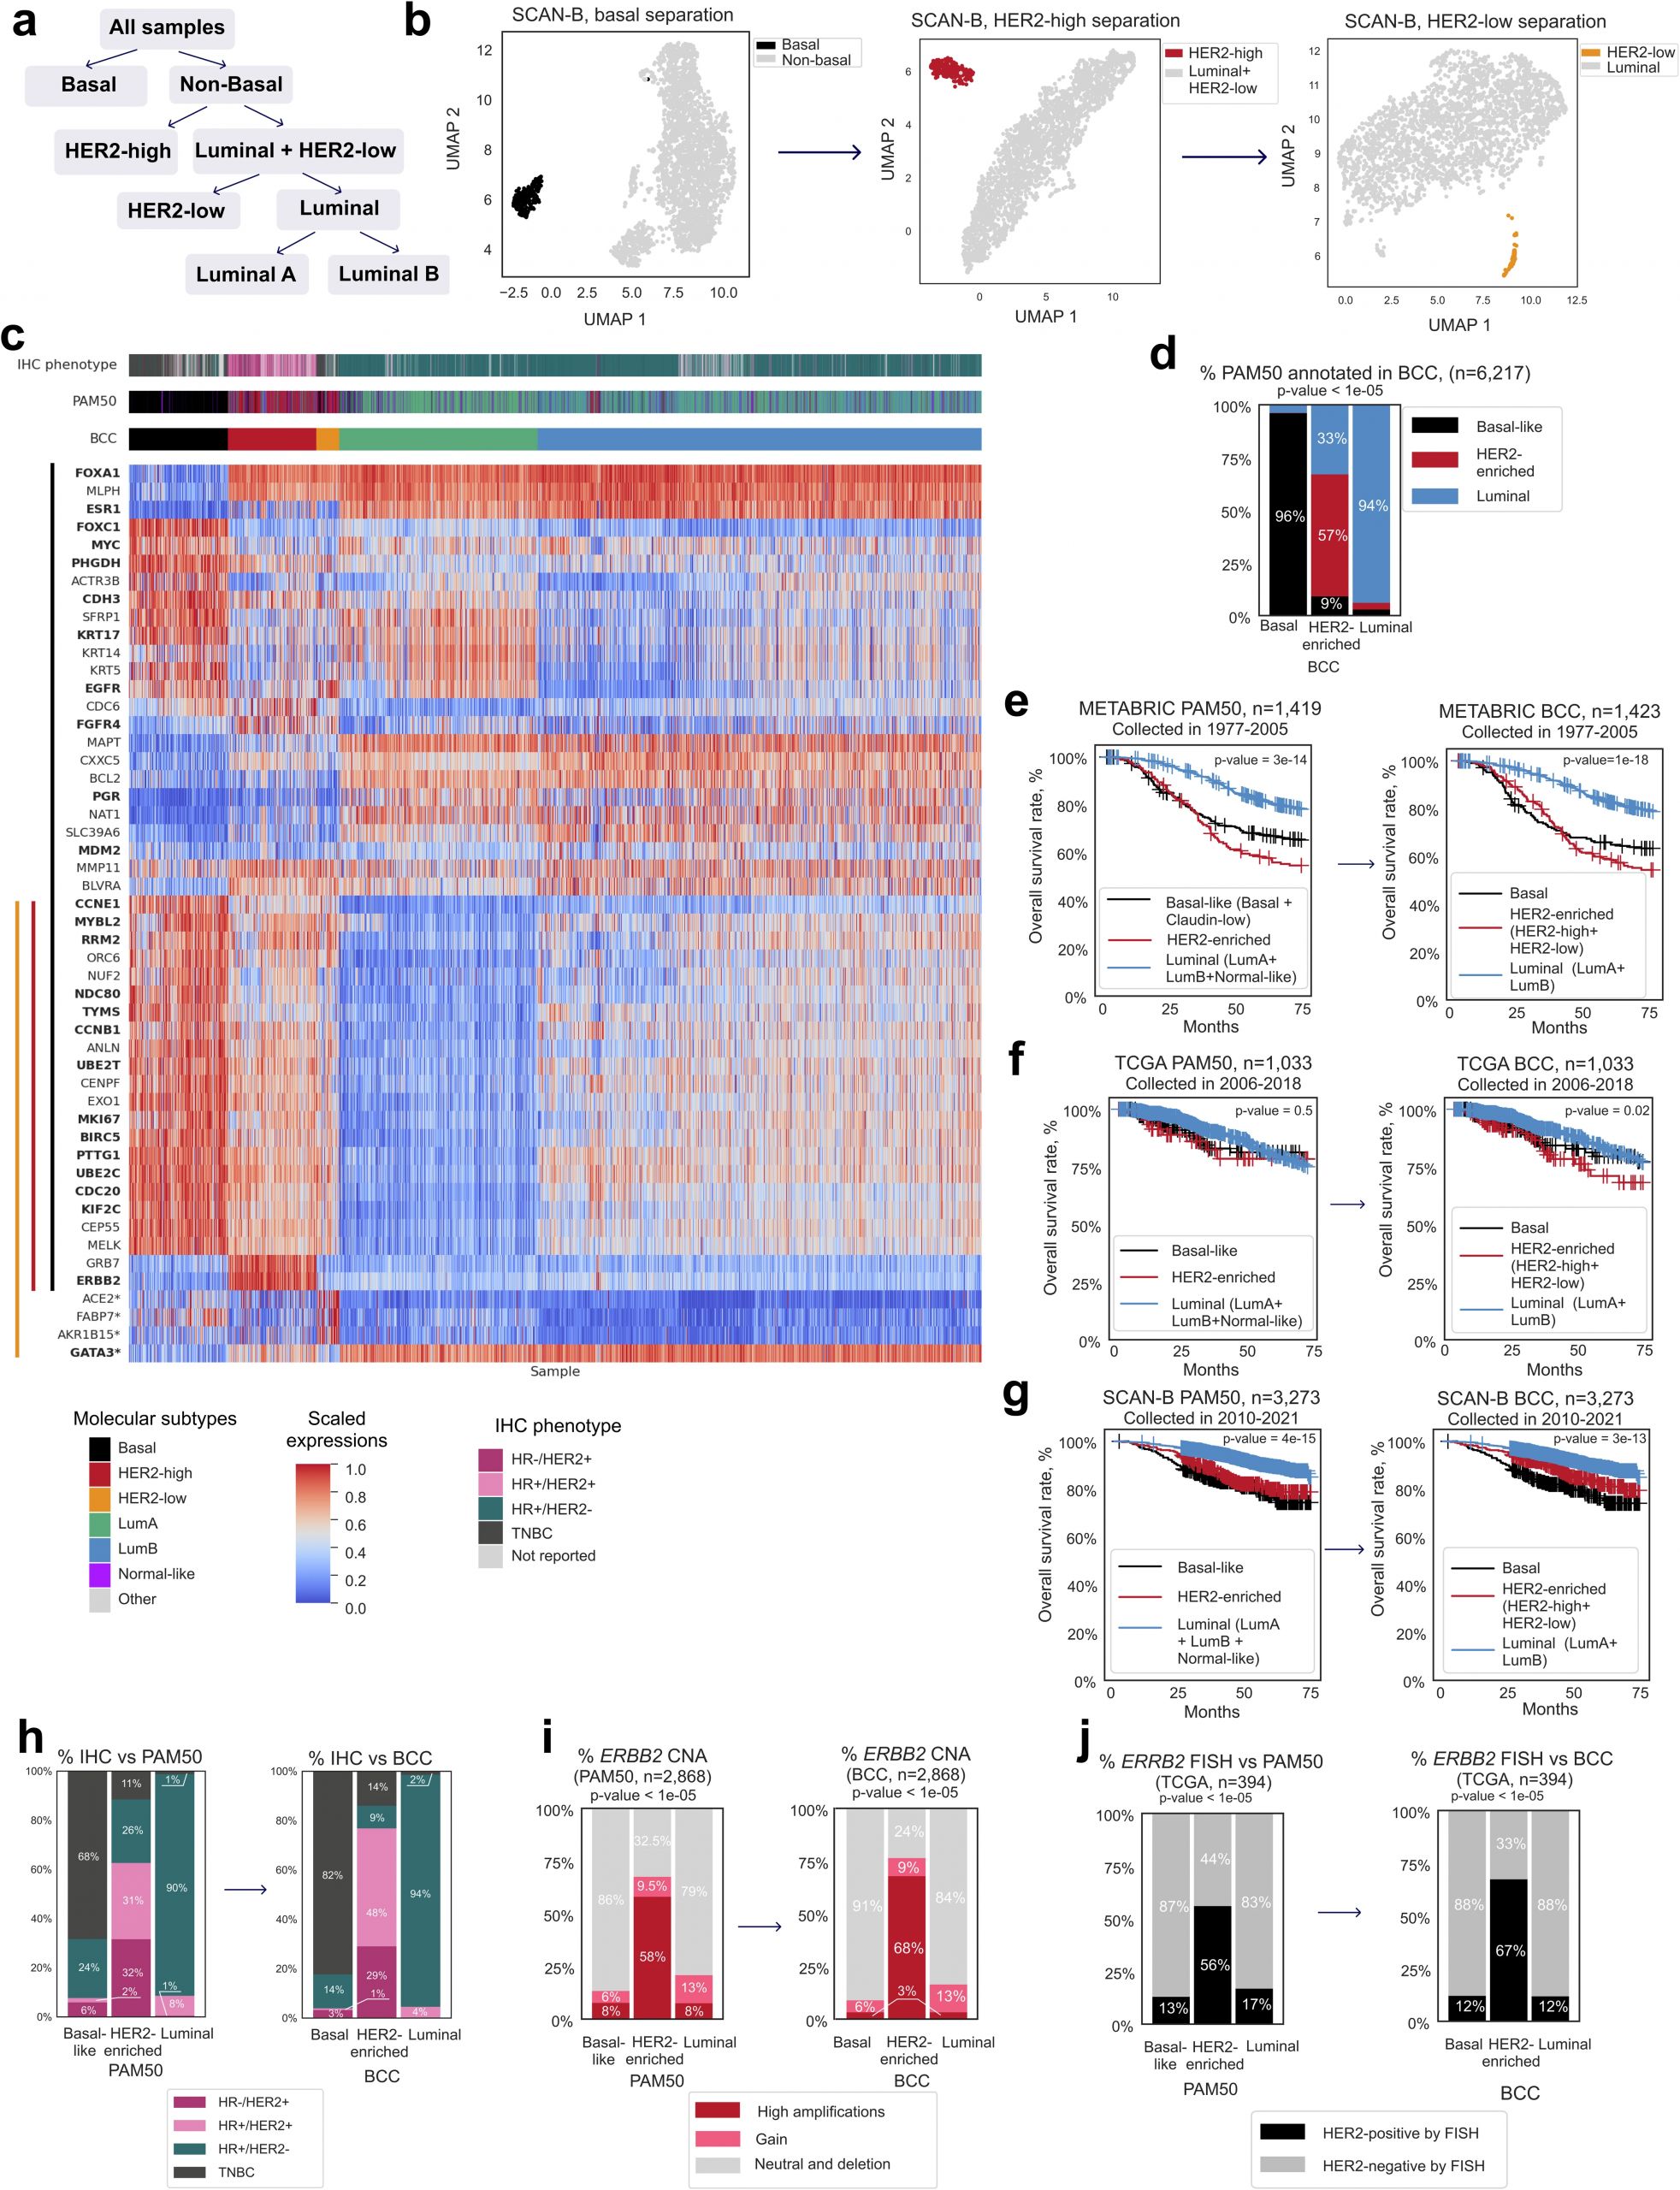
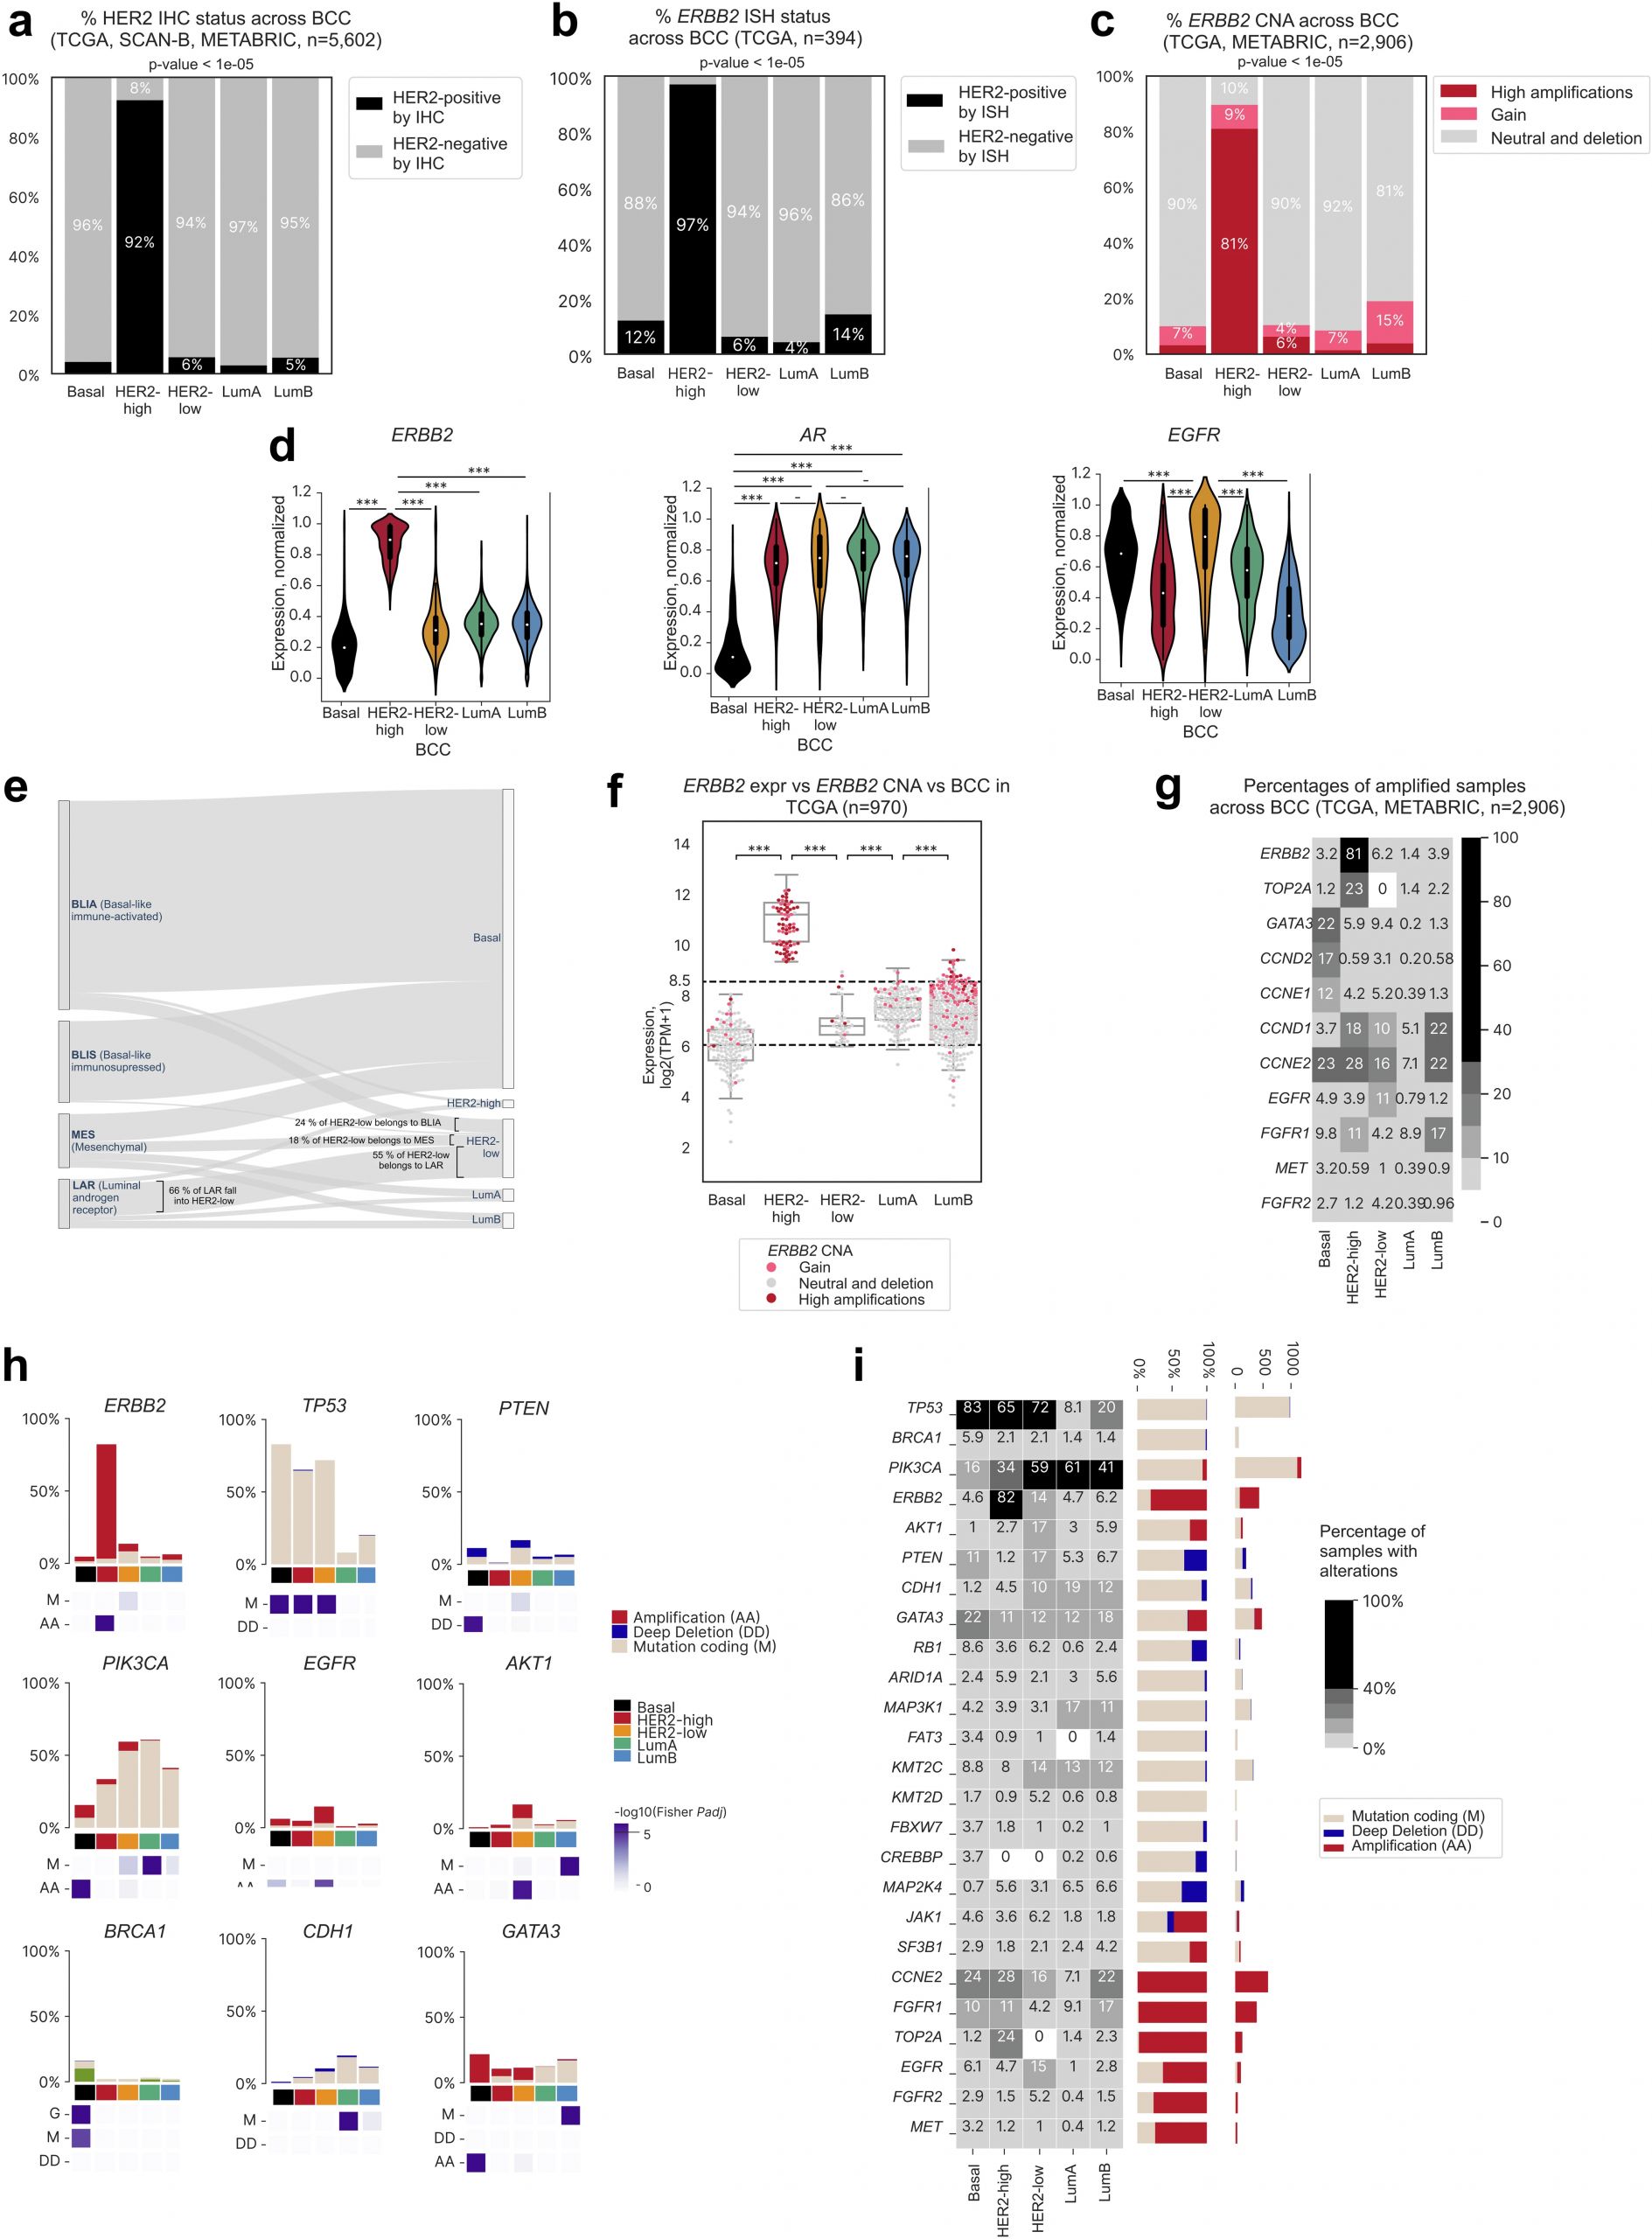
There is a well-known breast cancer classification called “PAM50” — it was developed about thirty years ago and describes molecular-level differences and their relationship to patient prognosis. Everyone knows and uses it, but due to legal restrictions, we could not apply it directly. Our goal was to redesign a similar classification — conceptually close, no worse, and ideally better.

I led the project: defined the problem, structured the narrative, broke it down into key blocks, selected the figures, grouped them into panels, and estimated the scope of work. The full analysis, writing, and final visualization were done by Polina Turova, the first author.

We redesigned the classifier, showed that it performs on par with the original, introduced a new HER2-low subtype, and removed the Normal-like subtype. In 2023, this work was presented at the SABCS conference as an abstract and poster, and in 2025 it was published in a solid journal.

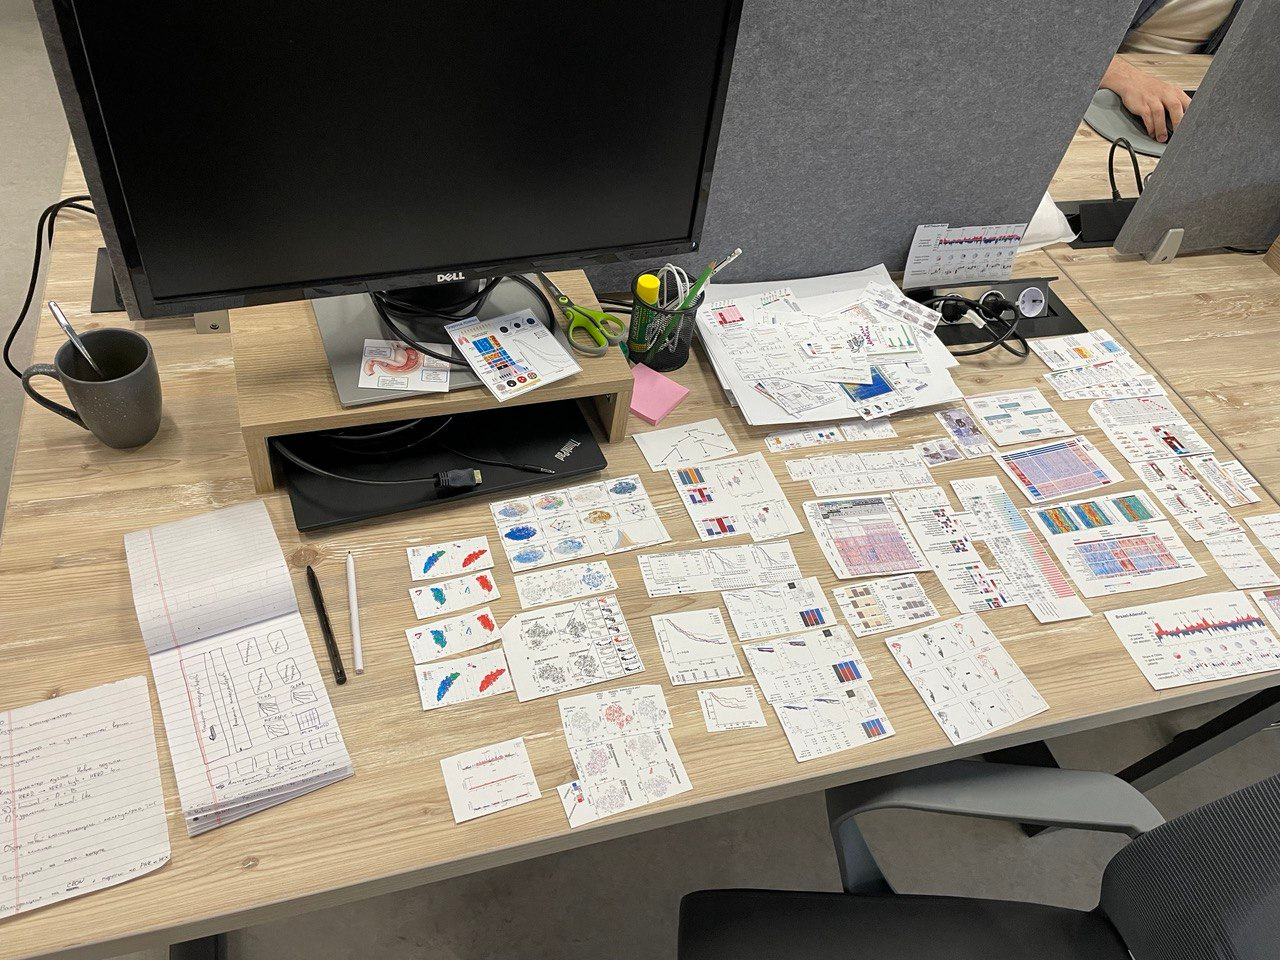
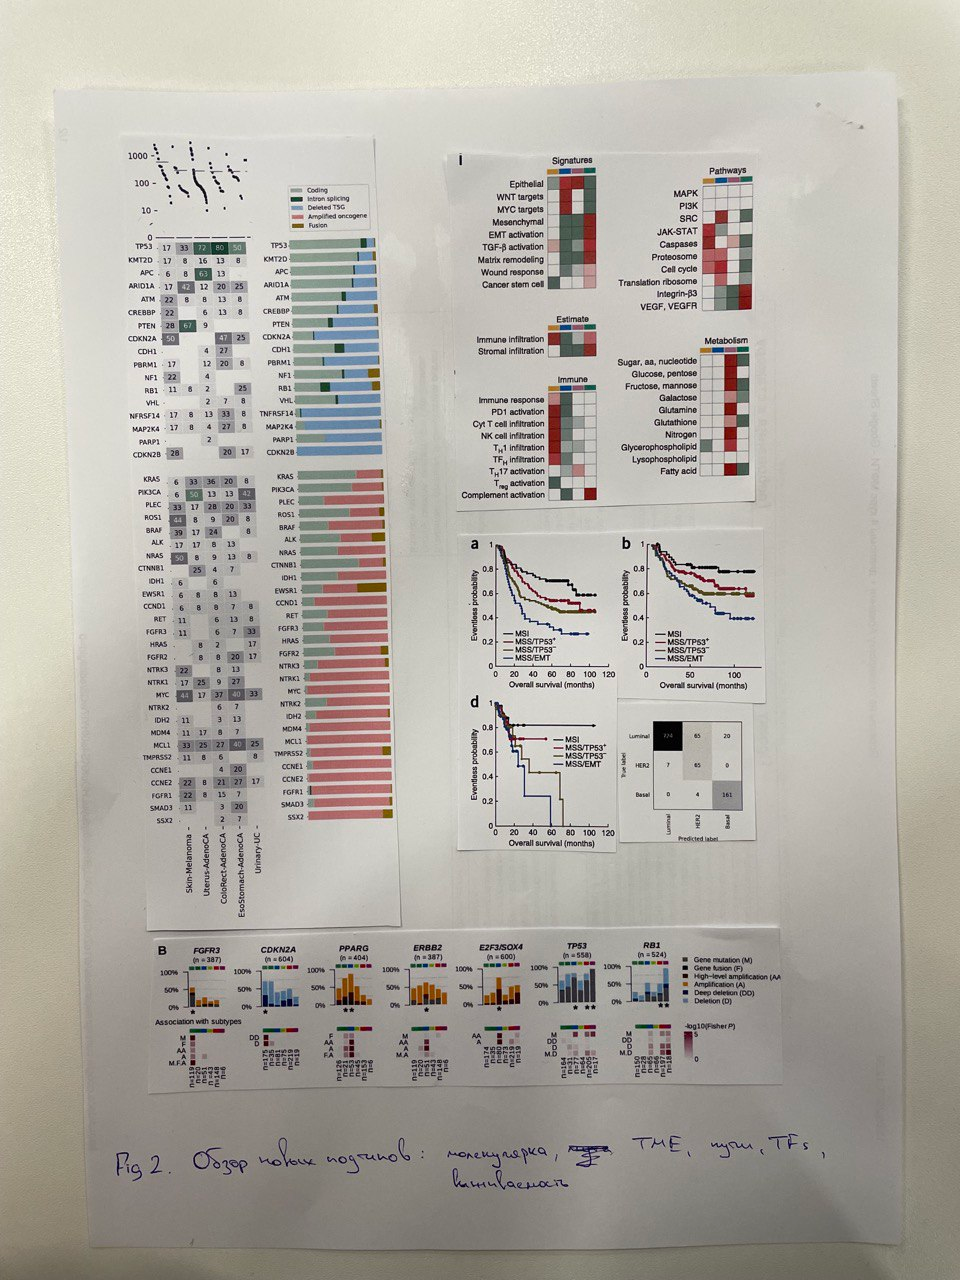
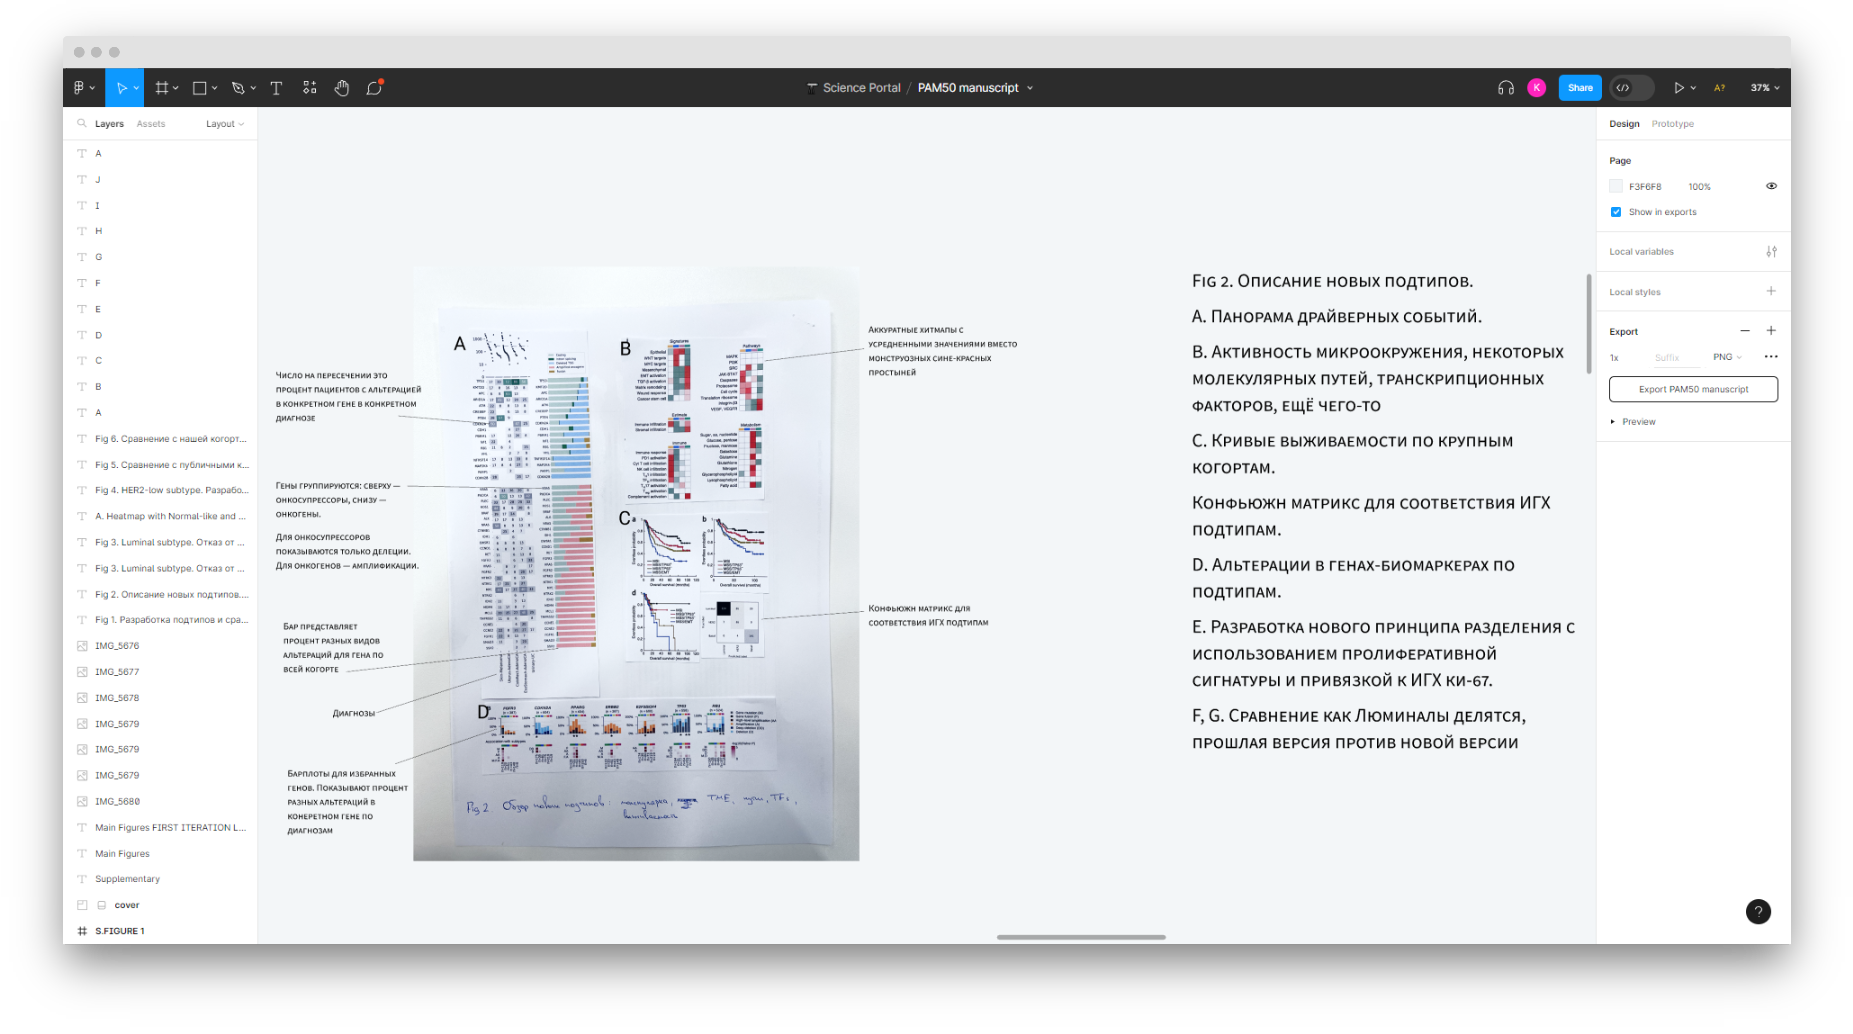
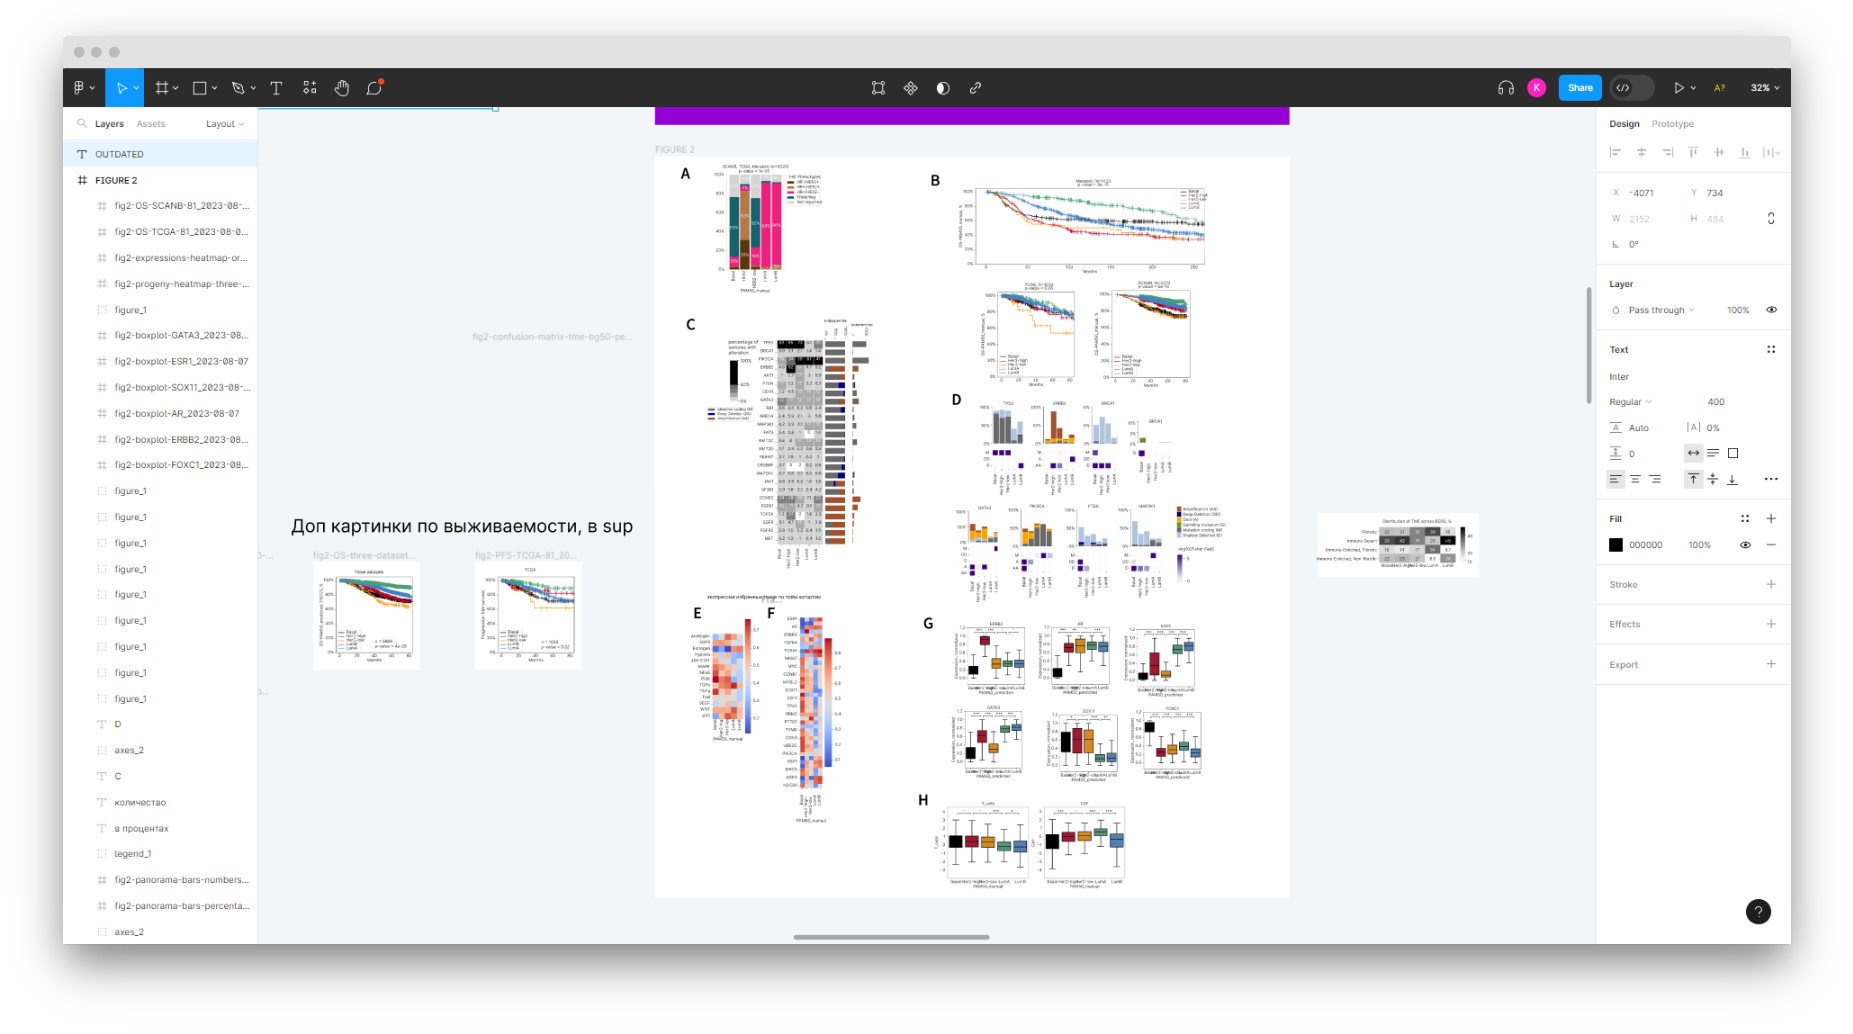
To design the figures, I printed relevant papers and plots, arranged them physically on paper, then recreated them in Figma, describing what problem each figure and chart solves. After that, Polina filled the drafts with real data and finalized them. Images 5 and 6 are the final versions published in the journal.

Paper ”Validation of combined DNA and RNA analysis in oncology...”

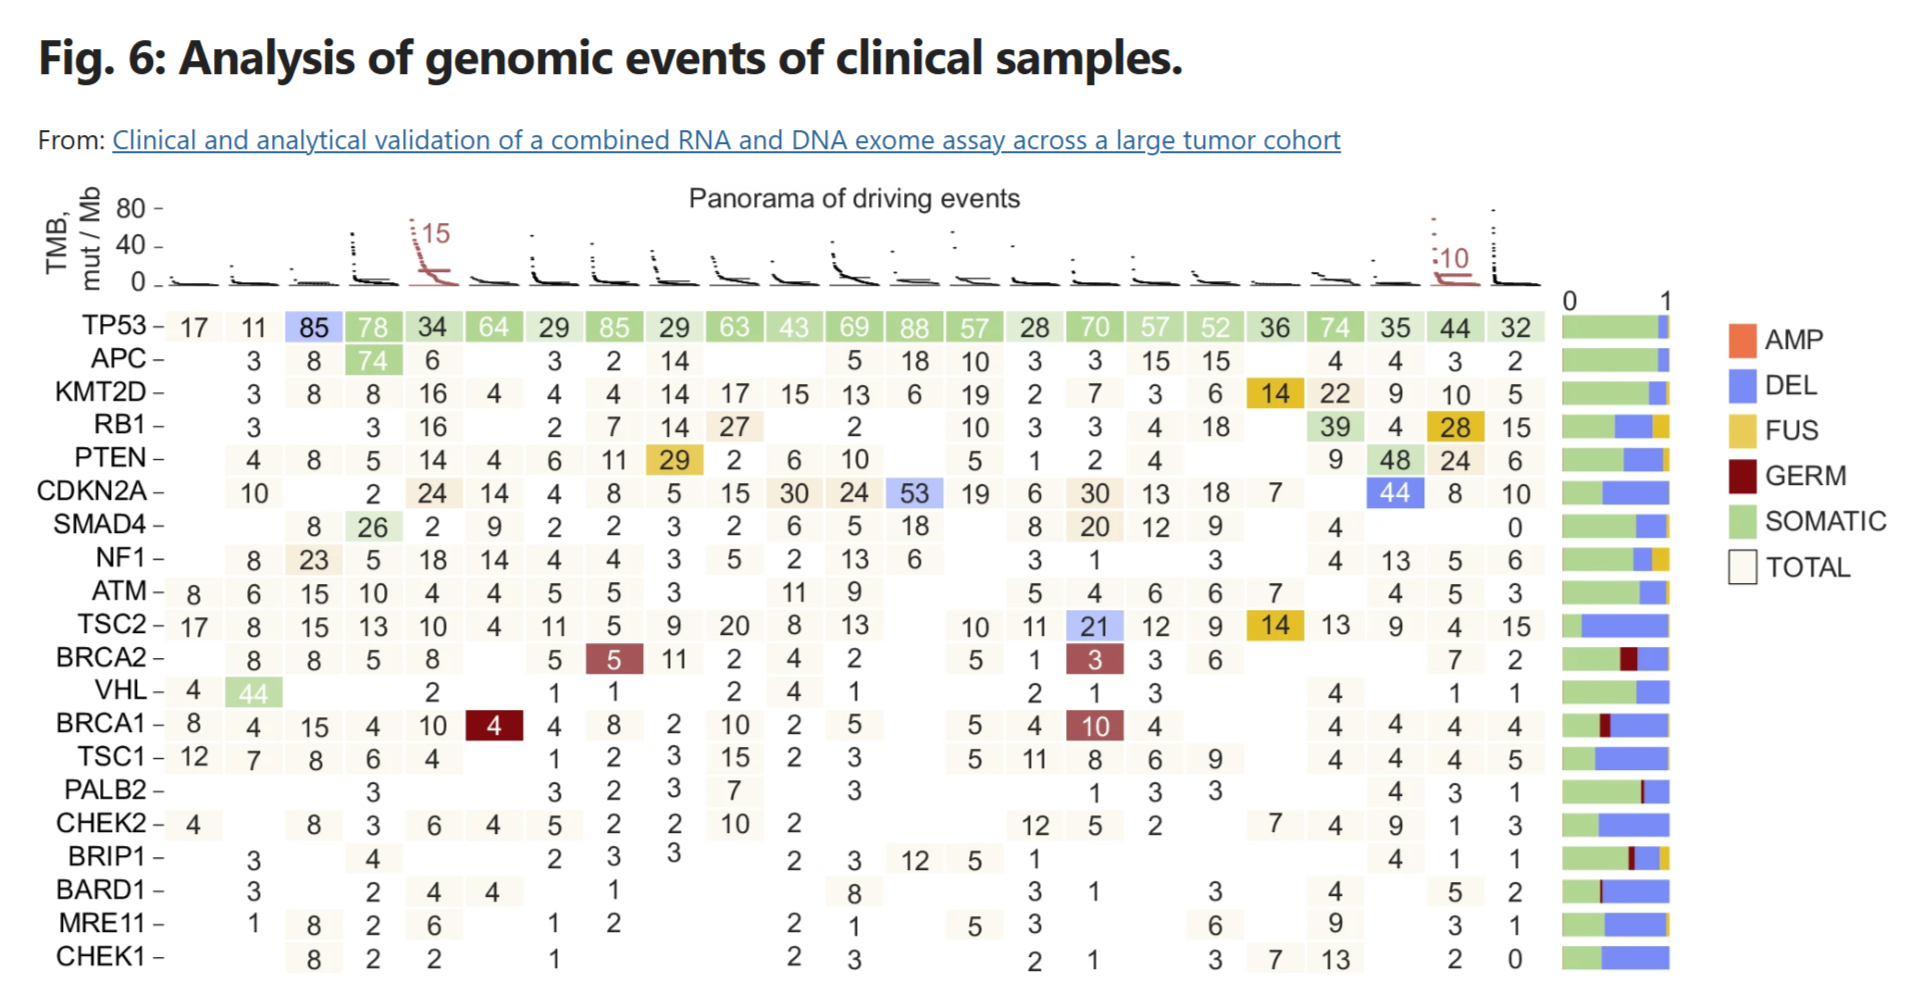
This paper describes how BostonGene analyzes patient data. I contributed to one of the sections — proposing a methodology for analyzing genetic events in patients and how to visualize them.

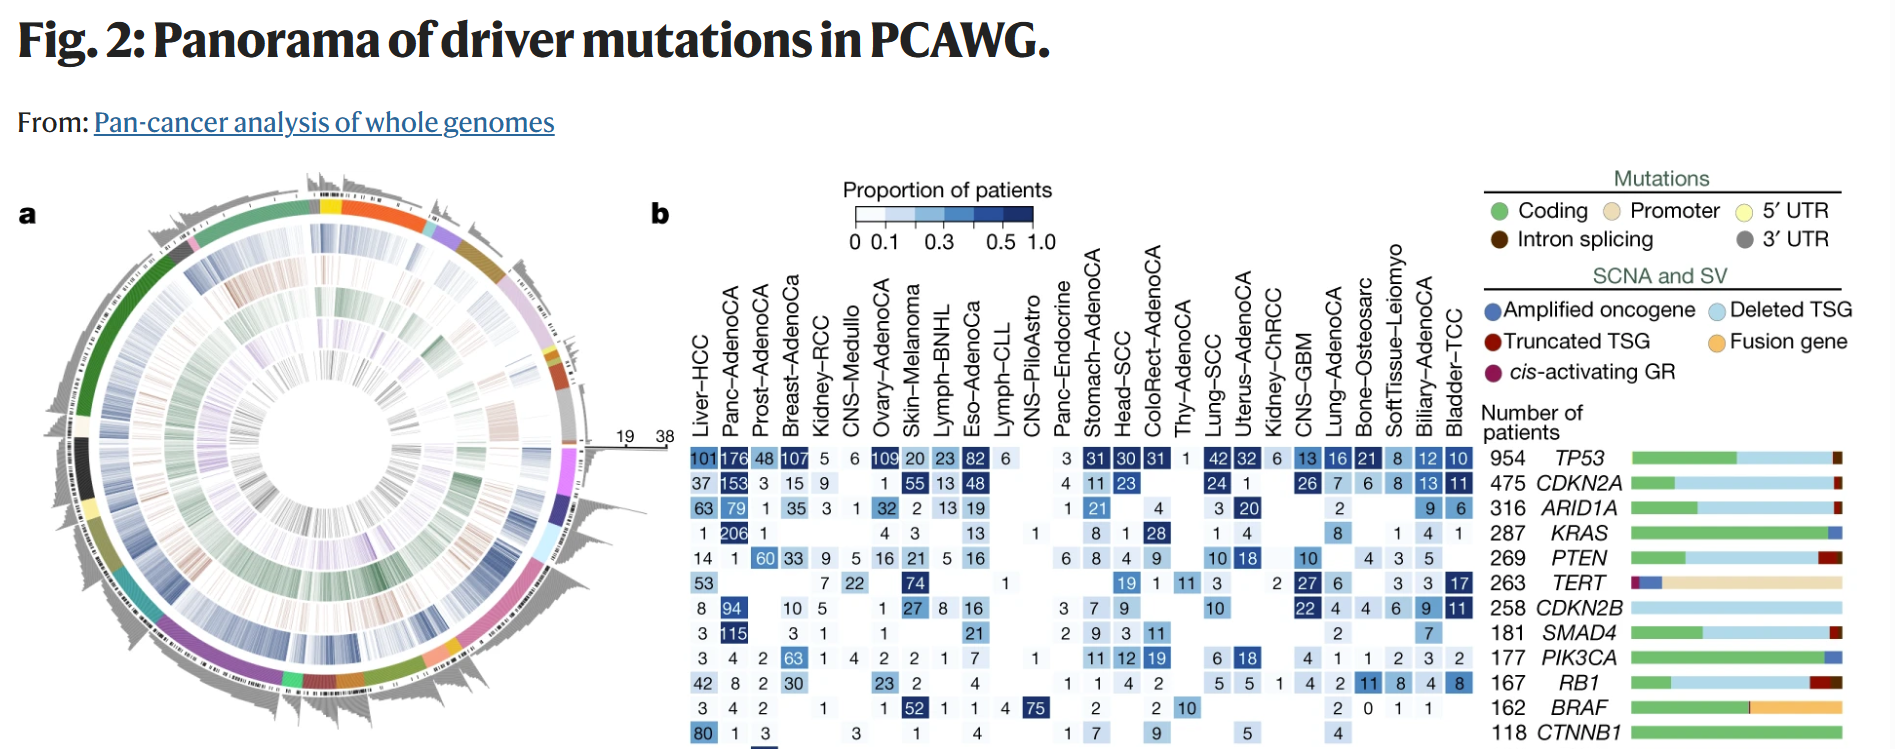
Only clinically significant genetic events were included in the analysis, as defined by a dedicated BostonGene team. The visualization is an adaptation of “Panorama of driver events” from another paper.

American Association for Cancer Research

A large oncology conference in the US, with a strong focus on translational medicine.

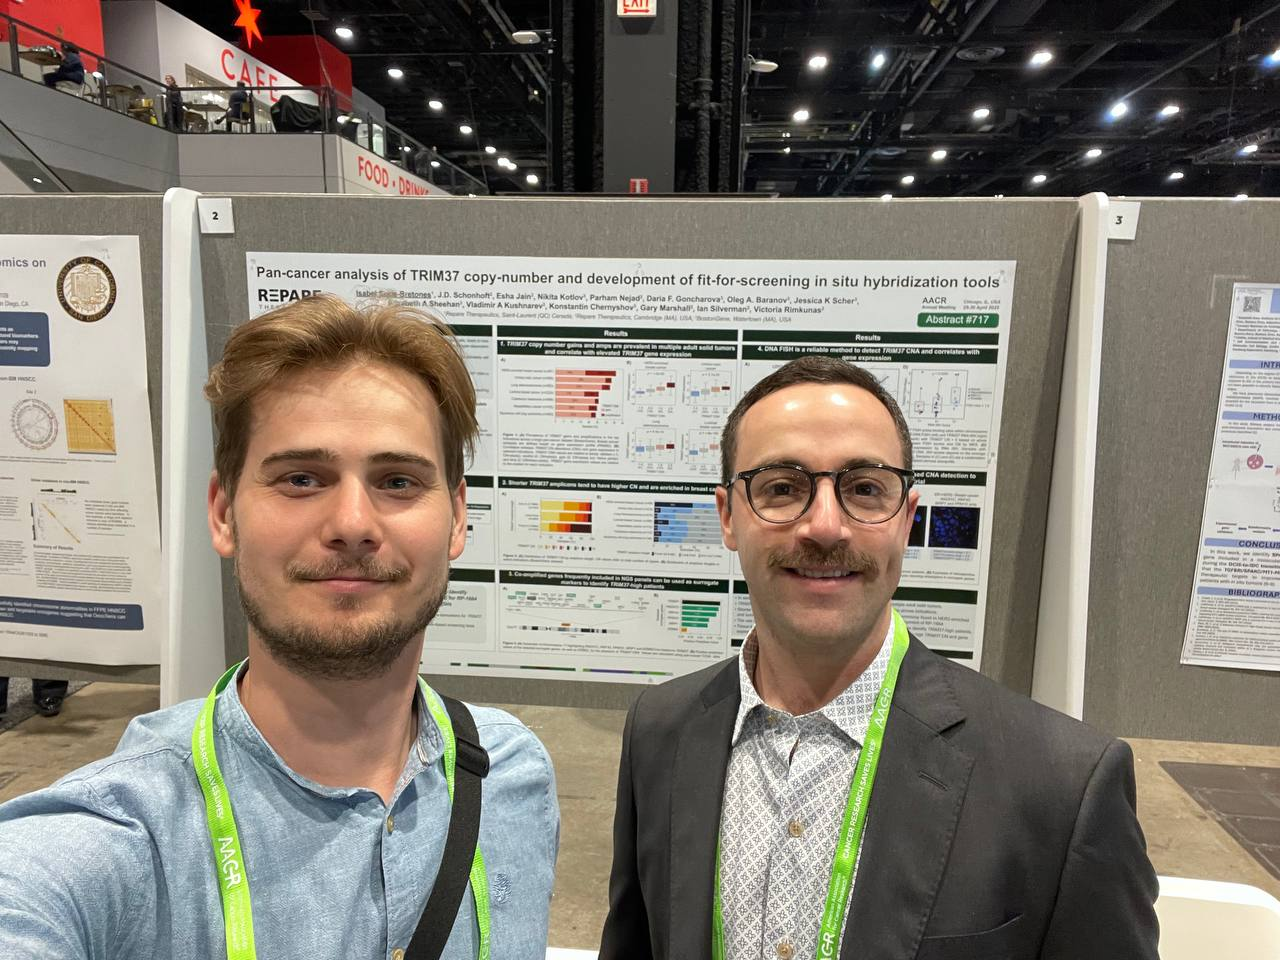
“Pan-cancer analysis of TRIM37 copy-number and development of fit-for-screening in situ hybridization tools”. AACR abstract book.

American Society of Clinical Oncology

The main clinical oncology conference in the US.

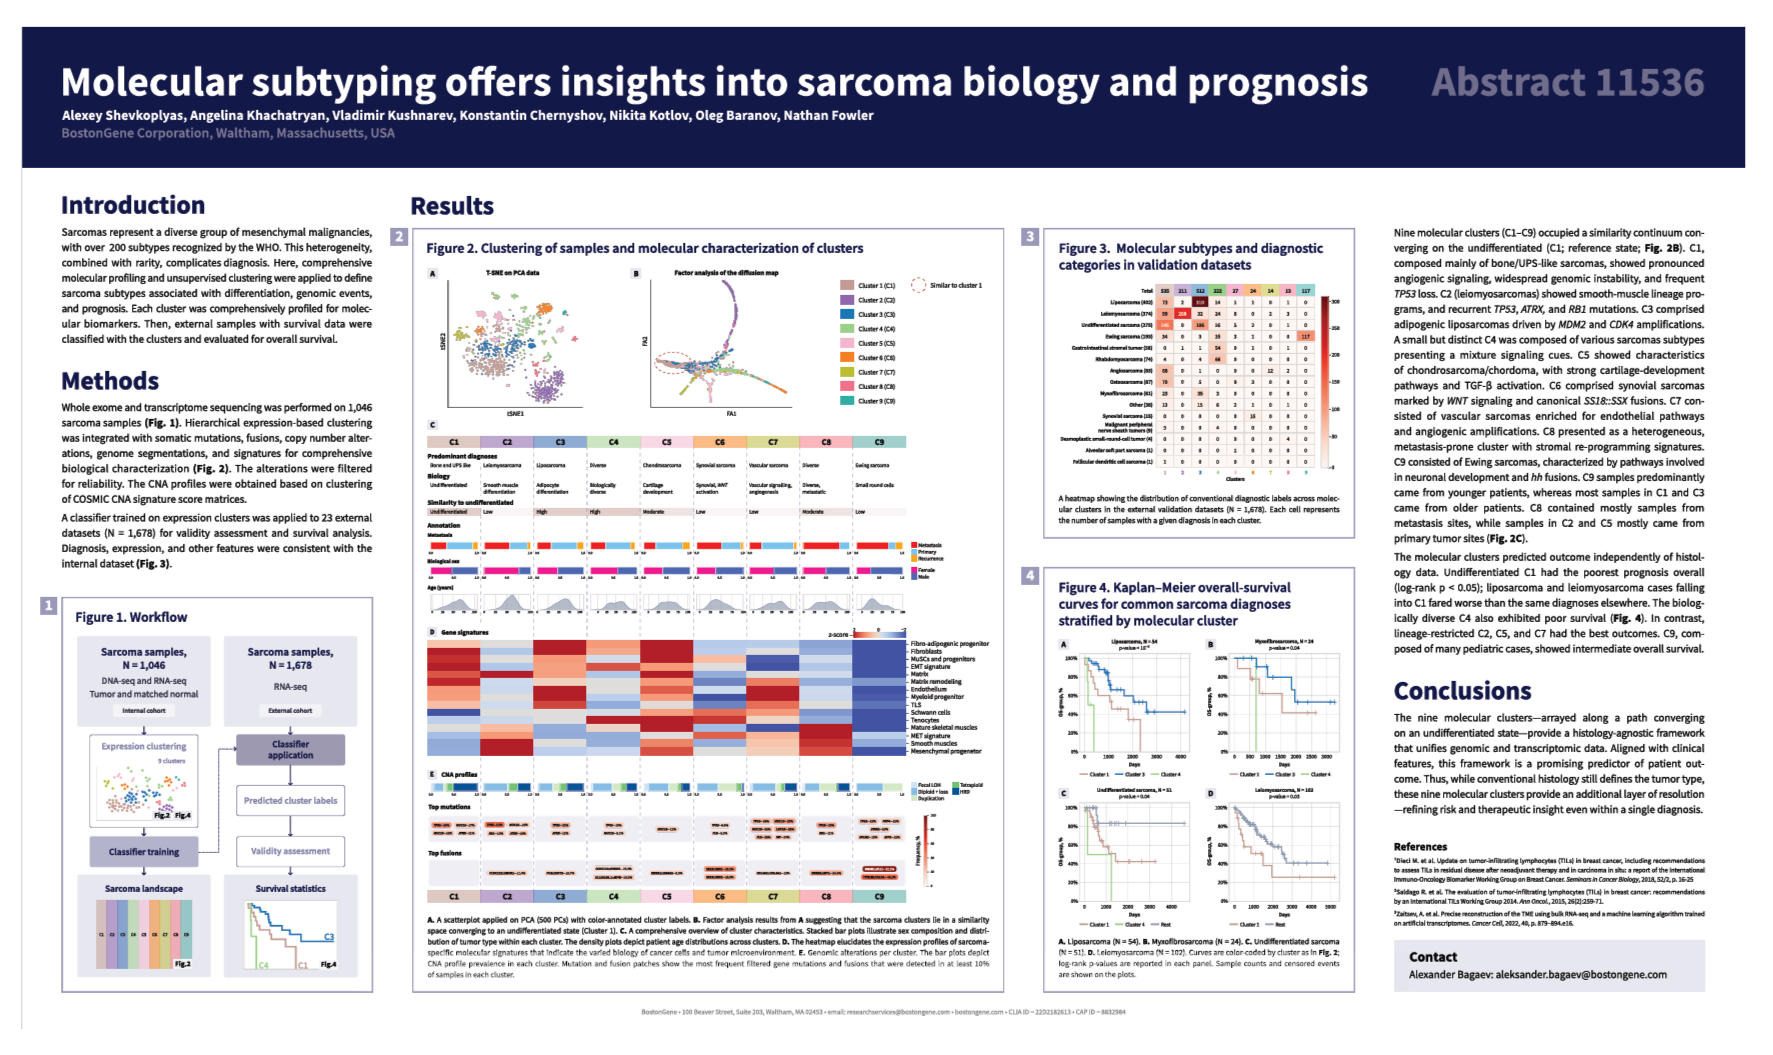
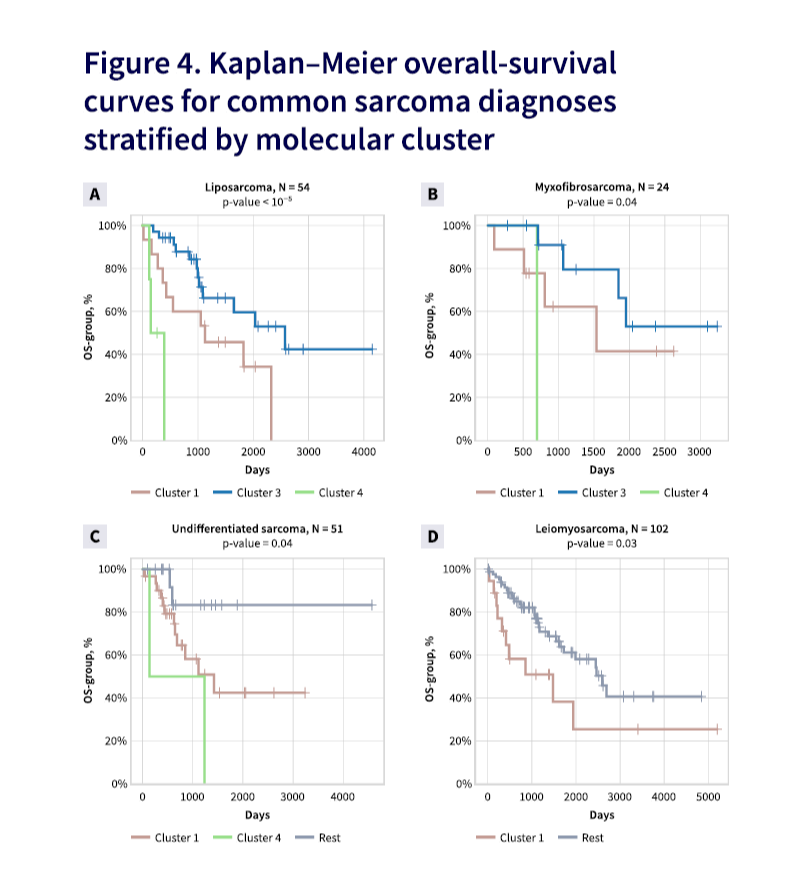
“Molecular subtyping and insights into sarcoma biology and prognosis”. ASCO abstract book.

American Society of Hematology

The largest conference on lymphomas and blood disorders in the world.

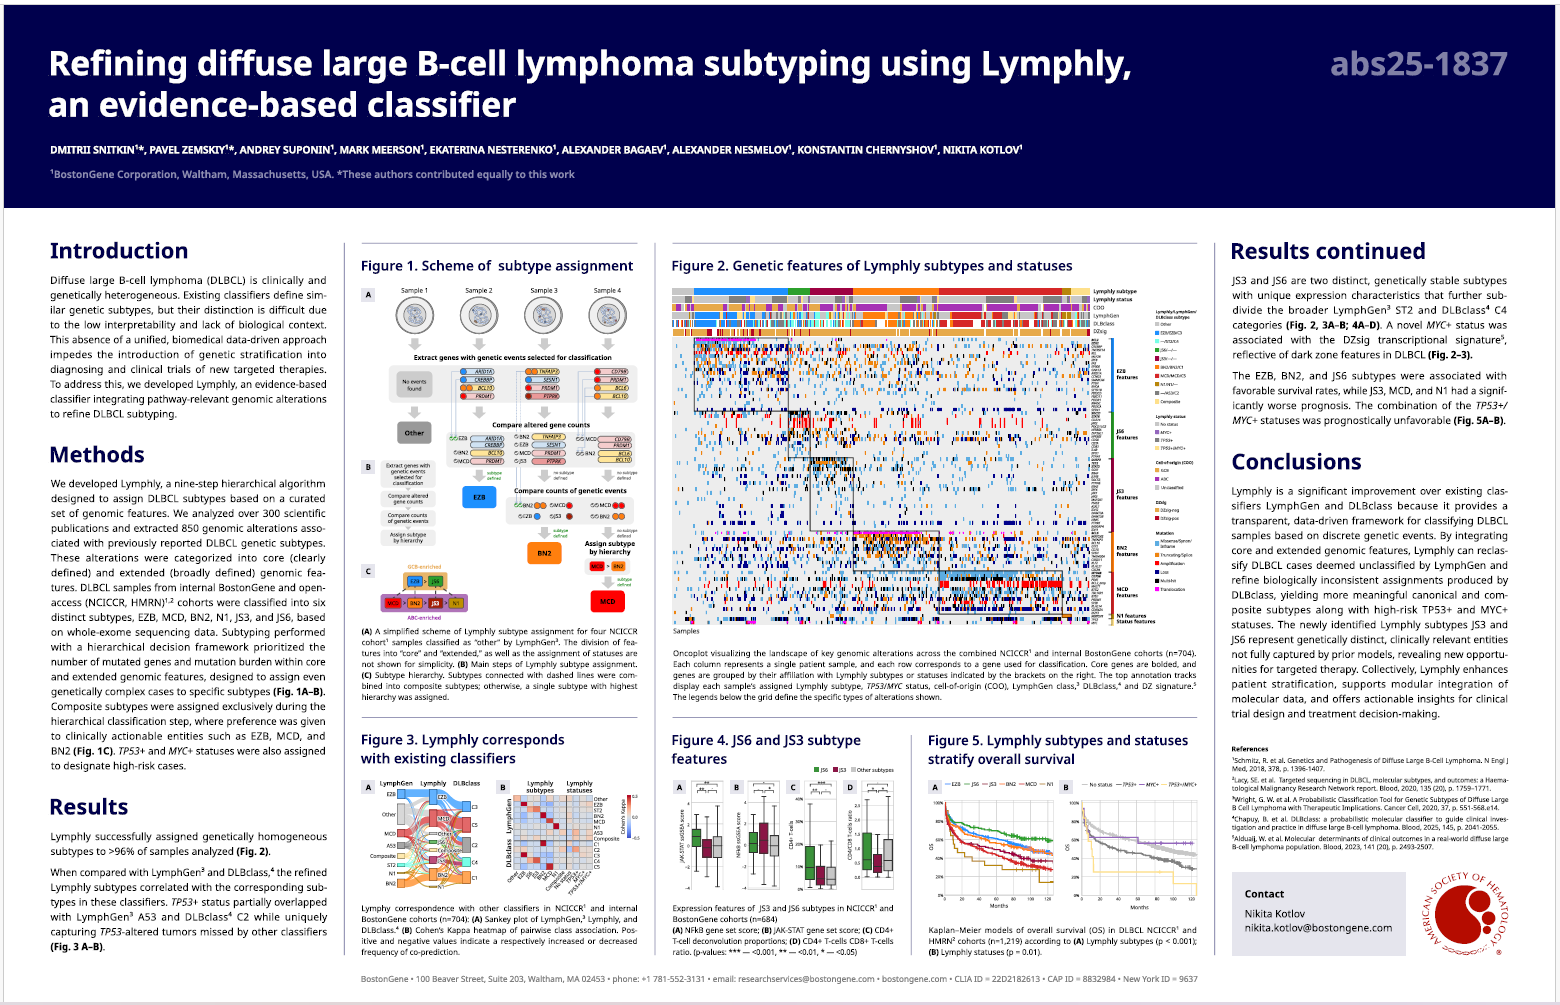
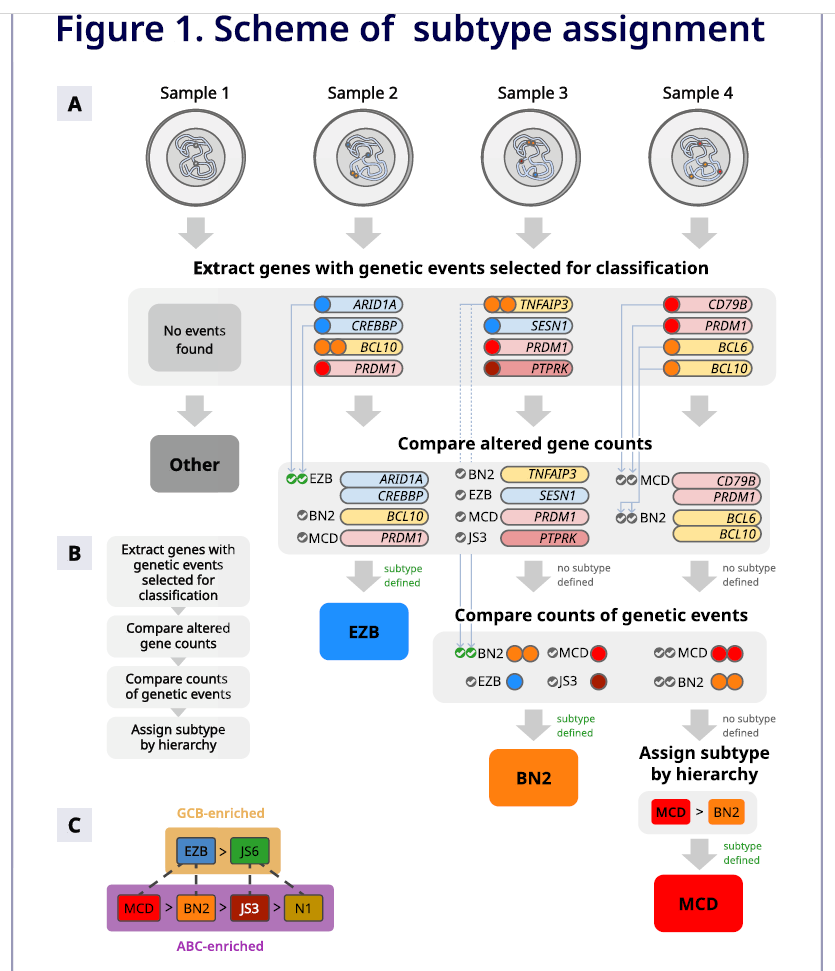
“Refining diffuse large B-cell lymphoma subtyping using lymphly, an evidence-based classifier”. BostonGene news. ASH conference site.

San-Antonio Breast Cancer Symposium

The largest conference on breast cancer in the world.

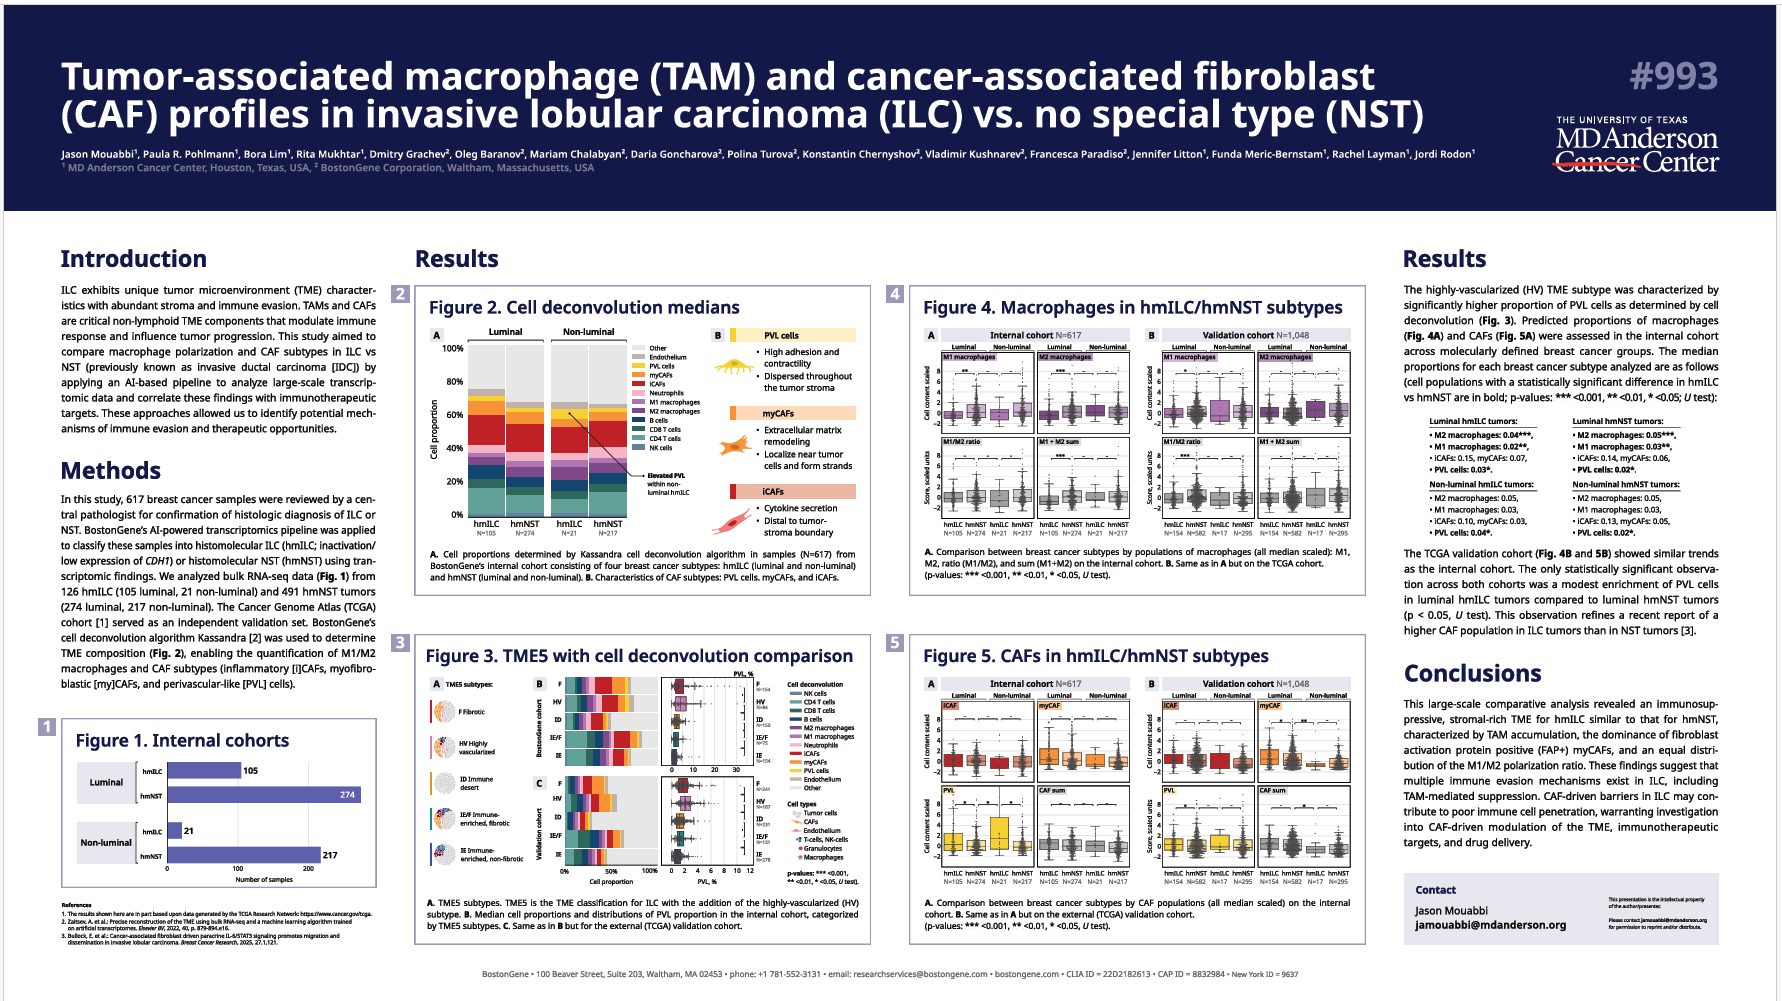
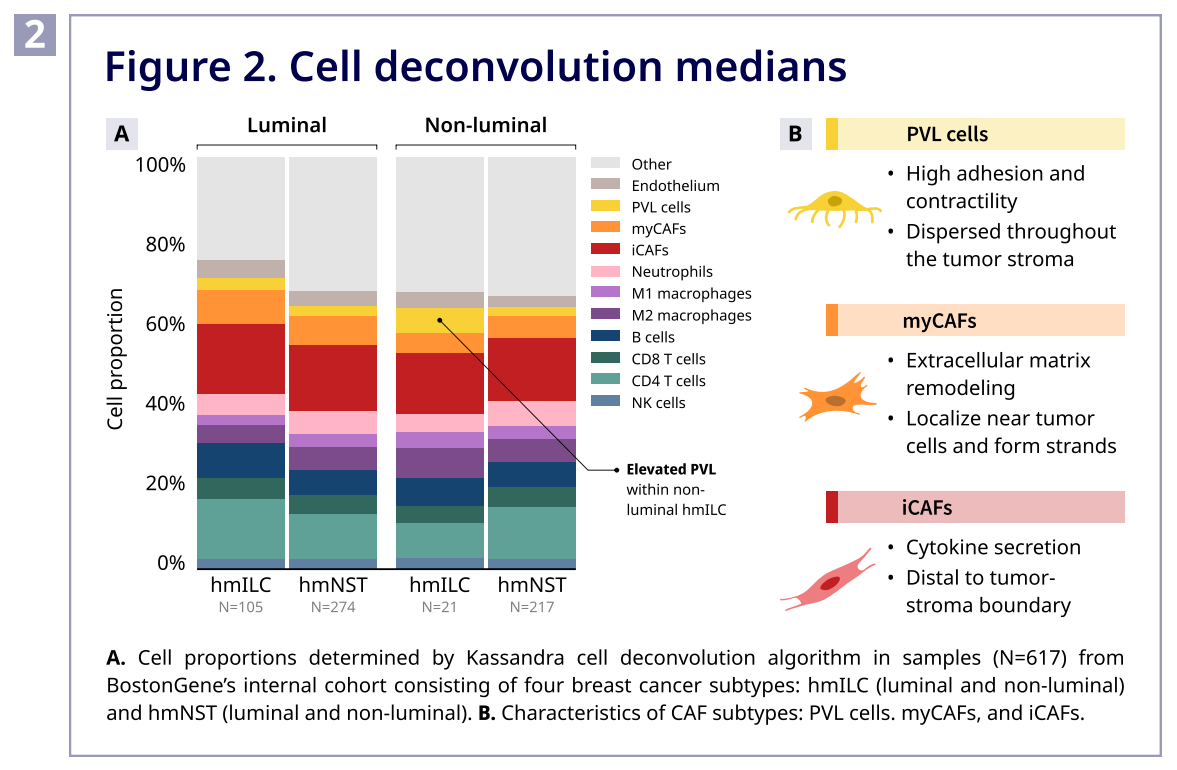
“Tumor-associated macrophage (TAMs) and cancer-associated fibroblasts (CAFs) profiles in invasive lobular carcinoma (ILC) vs no special type (NST)”. BostonGene news.
Earlier Ctrl + ↓